Telus 2014 Annual Report Download - page 33
Download and view the complete annual report
Please find page 33 of the 2014 Telus annual report below. You can navigate through the pages in the report by either clicking on the pages listed below, or by using the keyword search tool below to find specific information within the annual report.-
 1
1 -
2
-
3
-
4
-
5
-
6
-
7
-
8
-
9
-
10
-
11
-
12
-
13
-
14
-
15
-
16
-
17
-
18
-
19
-
20
-
21
-
22
-
 23
23 -
 24
24 -
 25
25 -
 26
26 -
 27
27 -
 28
28 -
 29
29 -
 30
30 -
 31
31 -
 32
32 -
 33
33 -
 34
34 -
 35
35 -
 36
36 -
 37
37 -
 38
38 -
 39
39 -
 40
40 -
 41
41 -
 42
42 -
 43
43 -
44
-
45
-
46
-
47
-
48
-
49
-
50
 |
 |

33
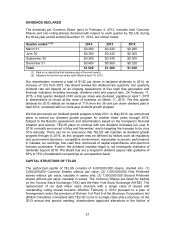
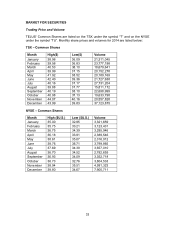
MARKET FOR SECURITIES
Trading Price and Volume
TELUS’ Common Shares are listed on the TSX under the symbol “T” and on the NYSE
under the symbol “TU”. Monthly share prices and volumes for 2014 are listed below:
TSX – Common Shares
Month High($) Low($) Volume
January 38.96 36.09 21,311,045
February 39.56 36.83 23,777,198
March 40.53 38.10 18,679,641
April 39.99 37.15 20,152,278
May 41.92 38.52 20,189,169
June 42.40 39.36 21,727,638
July 40.16 37.17 27,731,204
August 39.88 37.77 15,811,172
September 40.19 38.10 22,698,999
October 40.98 37.13 19,633,798
November 44.07 40.16 20,557,828
December 43.99 39.83 37,123,875
NYSE – Common Shares
Month High ($U.S.) Low ($U.S.) Volume
January 35.00 32.95 3,321,659
February 35.75 33.21 3,123,431
March 36.75 34.39 3,285,946
April 36.18 33.91 2,389,546
May 38.61 35.07 2,316,912
June 38.76 36.71 3,799,865
July 37.69 34.39 3,657,010
August 36.70 34.52 2,782,655
September 36.93 34.09 3,352,718
October 36.73 32.76 3,804,533
November 38.94 35.51 4,991,323
December 38.80 34.67 7,900,711