Telus 2012 Annual Report Download - page 26
Download and view the complete annual report
Please find page 26 of the 2012 Telus annual report below. You can navigate through the pages in the report by either clicking on the pages listed below, or by using the keyword search tool below to find specific information within the annual report.-
 1
1 -
2
-
3
-
4
-
5
-
6
-
7
-
8
-
9
-
10
-
11
-
12
-
13
-
14
-
15
-
 16
16 -
 17
17 -
 18
18 -
 19
19 -
 20
20 -
 21
21 -
 22
22 -
 23
23 -
 24
24 -
 25
25 -
 26
26 -
 27
27 -
 28
28 -
 29
29 -
 30
30 -
 31
31 -
 32
32 -
 33
33 -
 34
34 -
 35
35 -
 36
36 -
37
-
38
-
39
-
40
-
41
-
42
 |
 |

26
As is common practice, during the last two years, each of the above-noted credit rating
agencies charged TELUS for their rating services which include annual surveillance fees
covering our outstanding long-term and short-term debt securities, in addition to one-
time rating fees for certain agencies when debt is initially issued. We reasonably expect
that such payments will continue to be made for rating services in the future.
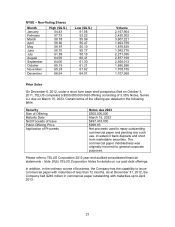
MARKET FOR SECURITIES
Trading Price and Volume
TELUS’ Common Shares are listed on the TSX under the symbol “T” and the Non-Voting
Shares were listed under the symbol “T.A” (until the delisting on February 11, 2013).
TELUS Non-Voting Shares were listed on the NYSE under the symbol “TU” (until the
delisting on February 4, 2013 in connection with the Share Exchange). As of February 4,
2013, TELUS Common Shares are now listed on the NYSE under the symbol “TU”.
Monthly share prices and volumes for 2012 are listed below:
TSX – Common and Non-Voting Shares
Month Common Shares Non-Voting Shares
High($) Low($) Volume High($) Low($) Volume
January 57.90 55.61 12,051,883 55.00 52.90 8,332,110
February 57.87 55.19 34,711,907 58.01 53.33 28,693,428
March 59.98 56.41 39,418,831 58.61 55.77 25,411,654
April 59.64 57.11 14,742,225 58.38 55.62 8,111,474
May 60.70 57.65 15,097,381 59.03 55.72 9,493,449
June 61.24 58.36 23,134,482 59.94 56.97 9,041,575
July 63.72 60.61 9,191,031 62.46 59.50 7,156,696
August 65.39 61.90 17,477,715 63.89 60.66 10,541,238
September 63.43 60.25 20,153,635 62.48 59.80 10,900,757
October 65.00 61.14 18,428,891 64.50 60.68 17,141,109
November 65.79 62.30 35,910,652 65.26 61.72 6,987,237
December 65.96 64.05 10,368,023 65.57 63.54 12,711,815