Telus 2007 Annual Report Download - page 42
Download and view the complete annual report
Please find page 42 of the 2007 Telus annual report below. You can navigate through the pages in the report by either clicking on the pages listed below, or by using the keyword search tool below to find specific information within the annual report.-
 1
1 -
2
-
3
-
4
-
5
-
6
-
7
-
8
-
9
-
10
-
11
-
12
-
13
-
14
-
15
-
16
-
17
-
18
-
19
-
20
-
21
-
22
-
23
-
24
-
25
-
26
-
27
-
28
-
29
-
30
-
31
-
 32
32 -
 33
33 -
 34
34 -
 35
35 -
 36
36 -
 37
37 -
 38
38 -
 39
39 -
 40
40 -
 41
41 -
 42
42 -
 43
43 -
 44
44 -
 45
45 -
 46
46 -
 47
47 -
 48
48 -
 49
49 -
 50
50 -
 51
51 -
 52
52
 |
 |

42
MARKET FOR SECURITIES
TELUS Common Shares and Non-Voting Shares are listed on the Toronto Stock
Exchange (“TSX”) under “T” and “T.A” respectively and the TELUS Non-Voting Shares
are listed on the New York Stock Exchange under “TU”. Monthly share prices and
volumes for 2007 are listed below:
TSX – Common and Non-Voting Shares
Month Common Shares Non-Voting Shares
High($) Low($) Volume High($) Low($) Volume
January 56.56 53.00 20,645,758 55.56 51.38 21,001,228
February 58.99 55.65 20,365,484 57.47 54.31 16,884,196
March 60.80 54.98 24,055,579 59.22 53.52 22,871,672
April 65.59 58.65 22,708,468 64.20 57.24 19,037,814
May 66.45 60.35 14,618,828 65.80 59.01 20,258,929
June 66.17 61.30 27,264,002 65.45 60.56 21,751,488
July 65.99 59.32 18,693,776 64.93 57.62 15,168,421
August 60.70 51.12 34,875,834 59.19 50.26 25,561,745
September 58.48 54.54 16,638,016 56.65 53.42 9,331,585
October 58.95 54.92 18,864,738 57.28 52.78 13,238,630
November 57.34 45.00 30,392,698 55.53 44.35 18,700,145
December 49.68 41.97 26,034,621 49.00 40.37 19,051,887
NYSE – Non-Voting Shares
Month High ($U.S.) Low ($U.S.) Volume
January 47.11 44.23 1,437,200
February 49.47 46.07 1,390,800
March 51.16 45.76 1,202,300
April 56.87 49.60 1,860,600
May 61.05 53.29 1,519,800
June 61.85 56.45 1,502,400
July 62.46 54.24 2,078,000
August 56.18 46.85 2,560,800
September 56.82 50.65 1,395,300
October 58.64 52.55 1,781,000
November 58.50 44.43 1,831,789
December 49.20 39.67 3,242,118
INTERESTS OF EXPERTS
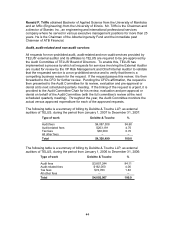
Deloitte & Touche LLP has audited the Consolidated financial statements of the
Company for the years ended December 31, 2007 and 2006 that are included in the
Company’s Annual Report filed under National Instrument 51-102 Continuous Disclosure
Obligations (portions of which are incorporated by reference into this AIF).