Suzuki 2002 Annual Report Download - page 40
Download and view the complete annual report
Please find page 40 of the 2002 Suzuki annual report below. You can navigate through the pages in the report by either clicking on the pages listed below, or by using the keyword search tool below to find specific information within the annual report.-
 1
1 -
2
-
3
-
4
-
5
-
6
-
7
-
8
-
9
-
10
-
11
-
12
-
13
-
14
-
15
-
16
-
17
-
18
-
19
-
20
-
21
-
22
-
23
-
24
-
25
-
26
-
27
-
28
-
29
-
 30
30 -
 31
31 -
 32
32 -
 33
33 -
 34
34 -
 35
35 -
 36
36 -
 37
37 -
 38
38 -
 39
39 -
 40
40 -
 41
41 -
 42
42 -
 43
43 -
 44
44
 |
 |
SUZUKI MOTOR CORPORATION
38
Thousands of
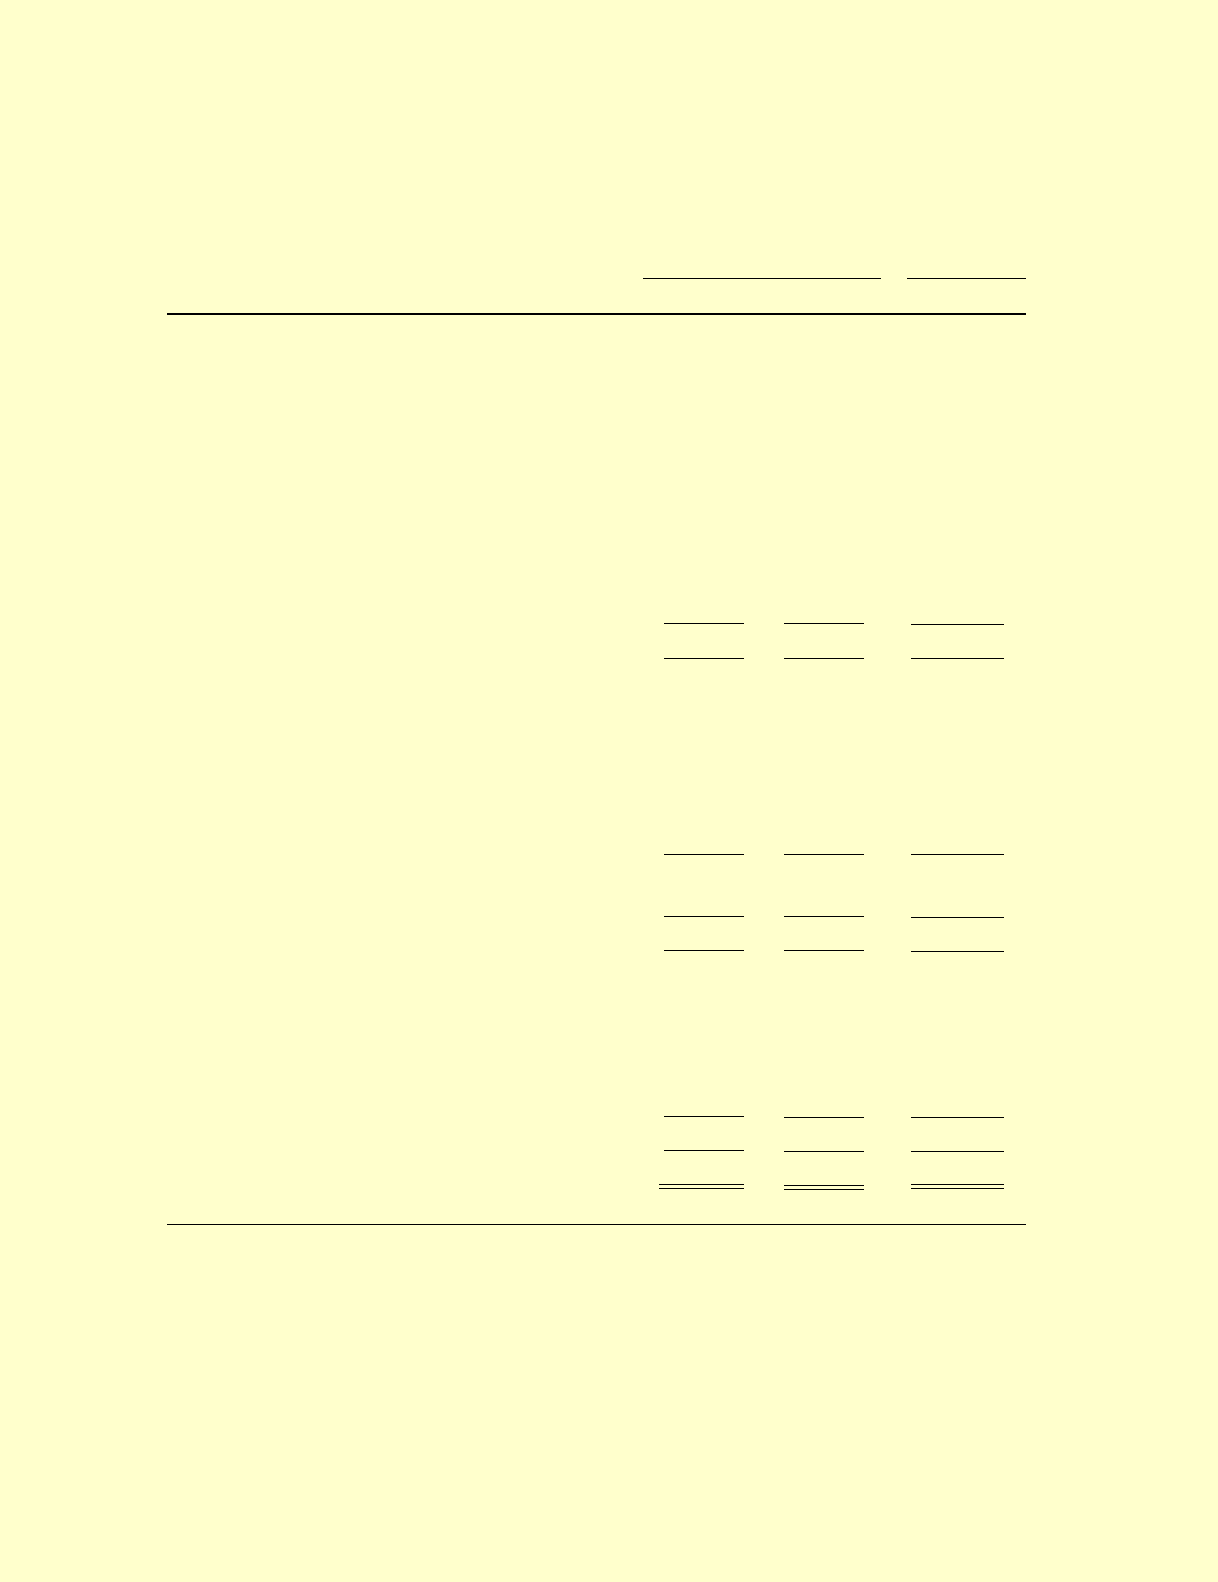
SUZUKI MOTOR CORPORATION Millions of yen U.S. dollars
2002 2001 2002
ASSETS
Current assets:
Cash and time deposits........................................................ ¥168,792 ¥217,306 $1,266,738
Marketable securities .......................................................... 47,080 0353,325
Treasury stock ..................................................................... —2—
Receivables:
Trade notes and accounts ................................................ 40,471 37,489 303,728
Subsidiaries and affiliates................................................ 113,191 95,751 849,468
Less allowance for doubtful receivables ......................... (343) (475) (2,574)
Inventories .......................................................................... 71,896 81,539 539,559
Other current assets............................................................. 123,740 71,929 928,635
Total current assets 564,830 503,543 4,238,880
Property, plant and equipment:
Land .................................................................................... 95,031 89,805 713,180
Buildings and structures...................................................... 160,309 152,828 1,203,076
Machinery and equipment................................................... 497,519 489,209 3,733,726
Construction in progress ..................................................... 1,458 5,985 10,949
754,319 737,829 5,660,932
Less accumulated depreciation........................................ (544,675) (527,302) (4,087,622)
209,643 210,526 1,573,309
Investments and other assets:
Investments in securities ..................................................... 70,958 100,563 532,520
Investments in subsidiaries
and affiliates .................................................................... 105,946 104,971 795,092
Other assets ......................................................................... 77,331 58,568 580,346
254,235 264,102 1,907,959
¥1,028,709 ¥978,172 $7,720,149
NON-CONSOLIDATED FINANCIAL STATEMENTS OF 2002
NON-CONSOLIDATED BALANCE SHEETS
As of March 31st, 2002 and 2001