Suzuki 2002 Annual Report Download - page 17
Download and view the complete annual report
Please find page 17 of the 2002 Suzuki annual report below. You can navigate through the pages in the report by either clicking on the pages listed below, or by using the keyword search tool below to find specific information within the annual report.-
 1
1 -
2
-
3
-
4
-
5
-
6
-
 7
7 -
 8
8 -
 9
9 -
 10
10 -
 11
11 -
 12
12 -
 13
13 -
 14
14 -
 15
15 -
 16
16 -
 17
17 -
 18
18 -
 19
19 -
 20
20 -
 21
21 -
 22
22 -
 23
23 -
 24
24 -
 25
25 -
 26
26 -
 27
27 -
28
-
29
-
30
-
31
-
32
-
33
-
34
-
35
-
36
-
37
-
38
-
39
-
40
-
41
-
42
-
43
-
44
 |
 |

SUZUKI MOTOR CORPORATION
15
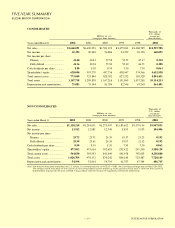
Years ended March 31 2002 2001 2000 1999 1998 2002
Net sales...................................... ¥1,668,251 ¥1,600,253 ¥1,521,192 ¥1,455,832 ¥1,488,785 $12,519,708
Net income.................................. 22,392 20,248 26,886 24,359 30,156 168,051
Net income per share:
Primary ................................... 41.40 40.41 55.58 52.72 67.17 0.310
Fully diluted ........................... 41.16 40.24 55.32 52.40 66.71 0.308
Cash dividends per share ............ 8.50 8.50 8.50 7.50 7.50 0.063
Shareholders' equity ................... 620,004 593,770 497,756 438,047 374,566 4,652,938
Total current assets ..................... 773,040 723,844 628,782 627,232 581,328 5,801,431
Total assets ................................. 1,347,718 1,299,859 1,167,216 1,131,849 1,037,280 10,114,213
Depreciation and amortization ... 75,083 75,344 81,784 82,546 67,263 563,481
FIVE-YEAR SUMMARY
SUZUKI MOTOR CORPORATION
CONSOLIDATED
NON-CONSOLIDATED
Thousands of
U.S. dollars
(except per
share amounts)
Years ended March 31 2002 2001 2000 1999 1998 2002
Net sales...................................... ¥1,320,218 ¥1,294,651 ¥1,273,907 ¥1,189,622 ¥1,179,136 $9,907,833
Net income.................................. 13,912 12,881 12,745 8,855 9,533 104,406
Net income per share:
Primary ................................... 25.72 25.71 26.35 19.17 21.23 0.193
Fully diluted ........................... 25.59 25.61 26.24 19.07 21.12 0.192
Cash dividends per share ............ 8.50 8.50 8.50 7.50 7.50 0.063
Shareholders' equity ................... 477,053 475,614 392,619 295,422 247,350 3,580,139
Total current assets ..................... 564,830 503,543 441,690 442,938 392,663 4,238,880
Total assets ................................. 1,028,709 978,172 870,242 806,140 723,487 7,720,149
Depreciation and amortization ... 54,194 52,814 59,701 61,787 47,344 406,715
Note: Yen amounts have been translated into U.S. dollars, for convenience only, at ¥133.25 = US$1, the prevailing exchange rate on March 29, 2002.
The treasury stock indicated on the column of non-consolidated current assets up to the previous fiscal year is listed on the column of
shareholders' equity from the year of 2002 in accordance with the revision of regulations of financial statements.
Millions of yen
(except per share amounts)
Thousands of
U.S. dollars
(except per
share amounts)
Millions of yen
(except per share amounts)