Suzuki 2002 Annual Report Download - page 4
Download and view the complete annual report
Please find page 4 of the 2002 Suzuki annual report below. You can navigate through the pages in the report by either clicking on the pages listed below, or by using the keyword search tool below to find specific information within the annual report.-
 1
1 -
 2
2 -
 3
3 -
 4
4 -
 5
5 -
 6
6 -
 7
7 -
 8
8 -
 9
9 -
 10
10 -
 11
11 -
 12
12 -
 13
13 -
 14
14 -
 15
15 -
16
-
17
-
18
-
19
-
20
-
21
-
22
-
23
-
24
-
25
-
26
-
27
-
28
-
29
-
30
-
31
-
32
-
33
-
34
-
35
-
36
-
37
-
38
-
39
-
40
-
41
-
42
-
43
-
44
 |
 |

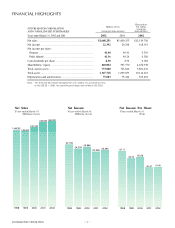
SUZUKI MOTOR CORPORATION
SUZUKI MOTOR CORPORATION
AND CONSOLIDATED SUBSIDIARIES
Thousands of
Millions of yen U.S. dollars
(except per
(except per share amounts) share amounts)
Years ended March 31, 2002 and 2001
2002 2001 2002
Net sales.................................................................................. ¥1,668,251 ¥1,600,253 $1$12,519,708
Net income.............................................................................. 22,392 20,248 168,051
Net income per share:
Primary ................................................................................ 41.40 40.41 0.310
Fully diluted......................................................................... 41.16 40.24 0.308
Cash dividends per share ........................................................ 8.50 8.50 0.063
Shareholders’ equity ............................................................... 620,004 593,770 4,64,652,938
Total current assets ................................................................. 773,040 723,844 5,801,431
Total assets ............................................................................. 1,347,718 1,299,859 110,114,213
Depreciation and amortization ............................................... 75,083 75,344 563,481
Note: Yen amounts have been translated into U.S. dollars, for convenience only,
at Yen133.25 = US$1, the prevailing exchange rate on March 29, 2002.
FINANCIAL HIGHLIGHTS
1999
24,359
2001
20,248
1998
30,156
1999
52.72
2001
40.41
1998
67.17
Years ended March 31
(Millions of yen)
Years ended March 31
(Millions of yen)
Years ended March 31
(Yen)
1999
1,455,832
2001
1,600,253
1998
1,488,785
2000
26,886
2000
55.58
2000
1,521,192
Net Sales Net Income Net Income Per Share
2002
22,392
2002
41.40
2002
1,668,251
2