Snapple 2012 Annual Report Download - page 6
Download and view the complete annual report
Please find page 6 of the 2012 Snapple annual report below. You can navigate through the pages in the report by either clicking on the pages listed below, or by using the keyword search tool below to find specific information within the annual report.-
 1
1 -
 2
2 -
 3
3 -
 4
4 -
 5
5 -
 6
6 -
 7
7 -
 8
8 -
 9
9 -
 10
10 -
 11
11 -
 12
12 -
 13
13 -
 14
14 -
 15
15 -
 16
16 -
 17
17 -
18
-
19
-
20
-
21
-
22
-
23
-
24
-
25
-
26
-
27
-
28
-
29
-
30
-
31
-
32
-
33
-
34
-
35
-
36
-
37
-
38
-
39
-
40
-
41
-
42
-
43
-
44
-
45
-
46
-
47
-
48
-
49
-
50
-
51
-
52
-
53
-
54
-
55
-
56
-
57
-
58
-
59
-
60
-
61
-
62
-
63
-
64
-
65
-
66
-
67
-
68
-
69
-
70
-
71
-
72
-
73
-
74
-
75
-
76
-
77
-
78
-
79
-
80
-
81
-
82
-
83
-
84
-
85
-
86
-
87
-
88
-
89
-
90
-
91
-
92
-
93
-
94
-
95
-
96
-
97
-
98
-
99
-
100
-
101
-
102
-
103
-
104
-
105
-
106
-
107
-
108
-
109
-
110
-
111
-
112
-
113
-
114
-
115
-
116
-
117
-
118
-
119
-
120
-
121
-
122
-
123
-
124
-
125
-
126
-
127
-
128
-
129
-
130
-
131
-
132
-
133
-
134
-
135
 |
 |

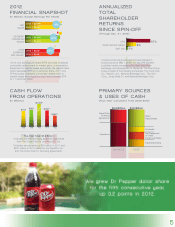
5
ANNUALIZED
TOTAL
SHAREHOLDER
RETURNS
SINCE SPIN-OFF
(Through Dec. 31, 2012)
1%S&P 500
6%PEERGROUPINDEX
15%DPS
Compound annual growth rate includes changes in
stock price since May 7, 2008, the day DPS became
apubliclytradedcompanyontheNewYorkStock
Exchange, and reinvestment of dividends. The Peer Group
Index consists of the following companies: The Coca-Cola
Co.,PepsiCo,Inc.,MonsterBeverageCorp.,TheCott
Corp.,JonesSodaCo.andNationalBeverageCorp.
CASH FLOW
FROM OPERATIONS
(In Millions)
$709
‘08
$865
‘09
$2,535*
‘10
$760**
‘11
$458**
‘12
Five-Year Total: $5.3 Billion
*Includes one-time licensing agreement payments
from The Coca-Cola Co. and PepsiCo, Inc.
**Includes tax payments of $54 million in 2011 and
$531 million in 2012 related to the PepsiCo, Inc.
and The Coca-Cola Co. licensing agreements.
PRIMARY SOURCES
& USES OF CASH
(Four-Year Cumulative Total 2009-2012)
SOURCES
Pepsi/Coke
Licensing
Agreements
Operations
Share
Repurchases
Dividends
Net Repayment
of Credit
Facility and Notes
Capital Spending
$4.6 Billion $4.6 Billion
USES
NET
SALES
SEGMENT
OPERATING
PROFIT
CORE
EARNINGS
PER SHARE*
+2%
2012
FINANCIAL SNAPSHOT
(In Millions, Except Earnings Per Share)
+2%
+2%
2012 | $5,995
2011 | $5,903
2012 | $1,364
2011 | $1,341
2012 | $2.92
2011 | $2.85
*2012 core earnings per share (EPS) excludes unrealized
commodity-related mark-to-market gains, a depreciation
adjustment on capital leases and certain tax-related items,
which decreased EPS by 4 cents per share. 2011 core
EPS excludes unrealized commodity-related mark-to-
market losses and a legal provision that increased EPS
by 11 cents per share.