Snapple 2012 Annual Report Download
Download and view the complete annual report
Please find the complete 2012 Snapple annual report below. You can navigate through the pages in the report by either clicking on the pages listed below, or by using the keyword search tool below to find specific information within the annual report.-
 1
1 -
 2
2 -
 3
3 -
 4
4 -
 5
5 -
 6
6 -
 7
7 -
 8
8 -
 9
9 -
 10
10 -
 11
11 -
 12
12 -
13
-
14
-
15
-
16
-
17
-
18
-
19
-
20
-
21
-
22
-
23
-
24
-
25
-
26
-
27
-
28
-
29
-
30
-
31
-
32
-
33
-
34
-
35
-
36
-
37
-
38
-
39
-
40
-
41
-
42
-
43
-
44
-
45
-
46
-
47
-
48
-
49
-
50
-
51
-
52
-
53
-
54
-
55
-
56
-
57
-
58
-
59
-
60
-
61
-
62
-
63
-
64
-
65
-
66
-
67
-
68
-
69
-
70
-
71
-
72
-
73
-
74
-
75
-
76
-
77
-
78
-
79
-
80
-
81
-
82
-
83
-
84
-
85
-
86
-
87
-
88
-
89
-
90
-
91
-
92
-
93
-
94
-
95
-
96
-
97
-
98
-
99
-
100
-
101
-
102
-
103
-
104
-
105
-
106
-
107
-
108
-
109
-
110
-
111
-
112
-
113
-
114
-
115
-
116
-
117
-
118
-
119
-
120
-
121
-
122
-
123
-
124
-
125
-
126
-
127
-
128
-
129
-
130
-
131
-
132
-
133
-
134
-
135
 |
 |
TABLE OF CONTENTS
1-5
6-7
8-9
10-11
12-13
117
STOCKHOLDER LETTER
LEADING WITH FLAVOR
BUILDING OUR BRANDS
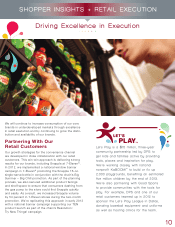
DRIVING EXCELLENCE
IN EXECUTION
CREATING
SHAREHOLDER VALUE
STOCKHOLDER
INFORMATION
ANNUAL REPORT 2012
Table of contents
-
Page 1
ANNUAL REPORT 2012 TABLE OF CONTENTS STOCKHOLDER LETTER LEADING WITH FLAVOR BUILDING OUR BRANDS DRIVING EXCELLENCE IN EXECUTION CREATING SHAREHOLDER VALUE STOCKHOLDER INFORMATION 1 -5 6 -7 8 -9 1 0 -11 1 2 -1 3 117 -
Page 2
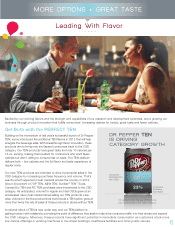
...the Board At Dr Pepper Snapple Group, fun, flavor and innovation combine to create our formula for growth. At Dr Pepper Snapple Group, we are known for our flavors. The 50-plus brands in our unmatched portfolio set us apart from our peers, providing the variety our customers and consumers want and... -
Page 3
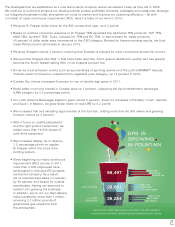
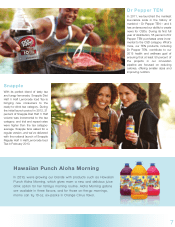
...fastest-selling SKU in the Snapple product line. •฀ Driven฀by฀local฀activation฀events฀such฀as฀sponsorships฀of฀sporting฀events฀and฀The฀Latin฀GRAMMY ® Awards, Clamato sales continued to outperform the vegetable juice category, up 15 percent in 2012. •฀ Canada฀Dry... -
Page 4
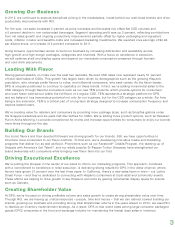
... of Snapple with America's Got Talent ® , and our wildly popular Dr Pepper Tuition Giveaway have strengthened our brand awareness with consumers while bringing new flavor fans into our fold. Driving Executional Excellence We're putting the shopper in the center of our plans to inform our marketing... -
Page 5
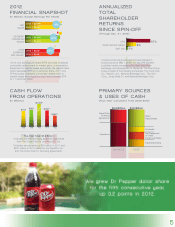
... create shareholder value in 2013 and beyond. Sincerely, Wayne R. Sanders Chairman of the Board Consumers selected DPS as the best among soft drink companies in the American Customer Satisfaction Index â„¢ report for 2012. We earned a score of 87, an increase of 6 percent over 2011. DPS was named... -
Page 6
... 2011 core EPS excludes unrealized commodity-related mark-tomarket losses and a legal provision that increased EPS by 11 cents per share. Compound annual growth rate includes changes in stock price since May 7, 2008, the day DPS became a฀publicly฀traded฀company฀on฀the฀New฀York฀Stock... -
Page 7
... traction with retailers by providing the point of difference they seek to help drive consumer traffic into their stores and expand the CSD category. Moreover, these products have significant potential in immediate consumption as customers stock more low-calorie offerings in vending machines in... -
Page 8
... its perfect blend of tasty tea and tangy lemonade, Snapple Diet Half 'n Half Lemonade Iced Tea is bringing new consumers to the ready-to-drink tea category. During the initial launch period in 2012, 21 percent of Snapple Diet Half 'n Half volume was incremental to the tea category, and trial and... -
Page 9
...world's largest social media network in 2012. Built on the strength of our Core 4 flavors (7UP, A&W, Sunkist ® soda and Canada Dry) and Sun Drop, this social media and retail activation campaign turned every consumer into a winner by awarding Facebook Credits, located under the cap of 20-oz. single... -
Page 10
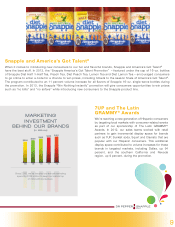
... new consumers to our fun and flavorful brands, Snapple and America's Got Talent ® have the best stuff. In 2012, the "Snapple America's Got Talent Promotion" - featured under the cap of 16-oz. bottles of Snapple Diet Half 'n Half Tea, Peach Tea, Diet Peach Tea, Lemon Tea and Diet Lemon Tea... -
Page 11
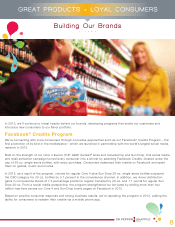
...our retail customers. This win-win approach is delivering strong results for our brands, including Snapple at 7-Eleven ® . In 2012, we implemented a national window banner campaign in 7-Eleven ® promoting the Snapple 16-oz. single-serve bottle in conjunction with the chain's Big Summer - Big Chill... -
Page 12
... the single largest opportunity for DPS in this area. In 2012, we increased the availability of the Dr Pepper product line across a key retail customer in the dollar channel, driving a volume increase of nearly 16 percent in this account. In addition, we gained distribution for flavors such... -
Page 13
... 2013, subject to market conditions. In 2013, we also announced the fifth increase to our dividend, and our annual payout is now $1.52 per share. Since we became a public company in 2008, our annualized total shareholder return has been 15 percent, outpacing both the 1 percent return of the S&P 500... -
Page 14
...more opportunity to improve, DPS is now world class among large CPG companies in the food and beverage industry for maintaining the lowest days sales in inventory. In 2013, we'll focus on driving Lean principles into more of our business, including direct-store-delivery order fulfillment, cold drink... -
Page 15
DR PEPPER SNAPPLE GROUP, INC. RECONCILIATION OF GAAP AND NON-GAAP INFORMATION For the Twelve Months Ended December 31, 2012 and 2011 (Unaudited) The company reports its financial results in accordance with accounting principles generally accepted in the United States of America ("U.S. GAAP"). ... -
Page 16
... 30, 2012, the last business day of the registrant's most recently completed second fiscal quarter, was $9,211,669,294 (based on the closing sale price of the registrant's common stock on that date as reported on the New York Stock Exchange). As of February 18, 2013, there were 203,632,429 shares of... -
Page 17
DR PEPPER SNAPPLE GROUP, INC. FORM 10-K For the Year Ended December 31, 2012 Page PART I. Item 1. Item 1A. Item 1B. Item 2. Item 3. Item 4. Business Risk Factors Unresolved Staff Comments Properties Legal Proceedings Mine Safety Disclosures PART II. Item 5. Item 6. Item 7. Item 7A. Item 8. Item 9. ... -
Page 18
... bottling and distribution companies; • recession, financial and credit market disruptions and other economic conditions; • weather, climate changes and the availability of water; • increases in the cost of raw materials and energy used in our business; • increases in the cost of employee... -
Page 19
PART I ITEM 1. BUSINESS OUR COMPANY Dr Pepper Snapple Group, Inc. is a leading integrated brand owner, manufacturer and distributor of non-alcoholic beverages in the United States ("U.S."), Canada and Mexico with a diverse portfolio of flavored (non-cola) carbonated soft drinks ("CSDs") and non-... -
Page 20
... Launched as a national brand in 2011 Other CSD brands • • #1 grapefruit CSD in the U.S. and a leading grapefruit CSD in Mexico Founded in 1938 • • • #3 orange CSD in the U.S. Flavors include orange, diet and other fruits Brand began as the all-natural orange flavor drink in 1906 2 -
Page 21
... (regular and diet) and value teas Brand also includes premium juices and juice drinks Founded in Brooklyn, New York in 1972 #1 branded shelf-stable fruit punch brand in the U.S. Brand includes a variety of fruit flavored and reduced calorie juice drinks Developed originally as an ice cream topping... -
Page 22
... flavors used to make syrup or finished beverages. We manufacture beverage concentrates that are used by our own Packaged Beverages and Latin America Beverages segments, as well as sold to third party bottling companies. According to Nielsen, we had a 20.7% share of the U.S. CSD market in 2012... -
Page 23
... business model enables us to be more flexible and responsive to the changing needs of our large retail customers by coordinating sales, service, distribution, promotions and product launches and allows us to more fully leverage our scale and reduce costs by creating greater geographic manufacturing... -
Page 24
... model to reduce costs by creating greater geographic manufacturing and distribution coverage and to be more flexible and responsive to the changing needs of our large retail customers by coordinating sales, service, distribution, promotions and product launches. Strengthen our route-to-market... -
Page 25
...Nantucket Nectars, Mr and Mrs T mixers, Mistic and Rose's. Key CSD brands in this segment include 7UP, Dr Pepper, A&W, Sunkist soda, Canada Dry, Squirt, RC Cola, Big Red, Vernors, Diet Rite and Sun Drop. Approximately 85% of our 2012 Packaged Beverages net sales of branded products come from our own... -
Page 26
... can use their resources and scale to rapidly respond to competitive pressures and changes in consumer preferences by introducing new products, reducing prices or increasing promotional activities. As a bottler and manufacturer, we also compete with a number of smaller bottlers and distributors and... -
Page 27
..., glass and PET cans and bottles and a variety of package formats, including single-serve and multi-serve packages and "bag-in-box" fountain syrup packaging. In 2012, 88% of our manufactured volumes came from our brands and 12% from third party and private-label products. We also use third party... -
Page 28
... the case of glass bottles, resin in the case of PET bottles and caps, corn in the case of sweeteners and pulp in the case of paperboard packaging. Manufacturing costs for our Packaged Beverages segment, where we manufacture and bottle finished beverages, are higher as a percentage of our net sales... -
Page 29
... as market share, retail pricing, promotional activity and distribution across various channels, retailers and geographies. Measured categories provided to us by Nielsen Scantrack include CSDs, energy drinks, single-serve bottled water, non-alcoholic mixers and NCBs, including ready-to-drink teas... -
Page 30
.... Smaller companies may be more innovative, better able to bring new products to market and better able to quickly exploit and serve niche markets. We have lower exposure to energy drinks, some of the faster growing NCBs and the bottled water segments in the overall LRB market. In Canada, Mexico and... -
Page 31
... as consumers have shifted towards low or no calorie soft drinks and, increasingly, to NCBs, such as water, ready-to-drink teas and sports drinks. If we do not effectively anticipate these trends and changing consumer preferences, then quickly develop new products in response, our sales could... -
Page 32
... our operations. Costs for raw materials and energy costs may increase substantially. The principal raw materials we use in our products are aluminum cans and ends, glass bottles, PET bottles and caps, paperboard packaging, sweeteners, juice, fruit, water and other ingredients. The cost of such raw... -
Page 33
... risks may be more acute where the supplier or its plant is located in riskier or less-developed countries or regions. Any significant interruption to supply or cost increase could substantially harm our business and financial performance. Substantial disruption to production at our manufacturing... -
Page 34
... efficiently transact our business, provide information to management and prepare financial reports. We rely on third party providers for a number of key information systems and business processing services, including hosting our primary data center and processing various accounting, order entry and... -
Page 35
... to manage our business may be adversely affected. We do not have "key person" life insurance for any of our executive officers or key employees. Changes in accounting standards could affect our reported financial results. The number of new accounting standards or pronouncements is increasing as... -
Page 36
... segment is our corporate headquarters located in Plano, Texas. (2) The three manufacturing facilities owned by Latin America Beverages operating segment includes the manufacturing facility for our joint venture with Acqua Minerale San Benedetto. We believe our facilities in the U.S. and Mexico... -
Page 37
..., RELATED STOCKHOLDER MATTERS AND ISSUER PURCHASES OF EQUITY SECURITIES In the United States, our common stock is listed and traded on the New York Stock Exchange under the symbol "DPS". Information as to the high and low sales prices of our stock for the two years ended December 31, 2012 and 2011... -
Page 38
...up to $200 million of the Company's outstanding common stock during 2010, 2011 and 2012. On February 24, 2010, the Board approved the repurchase of up to an additional $800 million of the Company's outstanding common stock, bringing the total aggregate share repurchase authorization up to $1 billion... -
Page 39
... following table presents selected historical financial data as of December 31, 2012, 2011, 2010, 2009 and 2008. All the selected historical financial data has been derived from our Audited Consolidated Financial Statements and is stated in millions of dollars except for per share information. 21 -
Page 40
... average number of common shares outstanding used in the calculation of earnings (loss) per share ("EPS") was impacted by the repurchase and retirement of DPS common stock. For the years ended December 31, 2012, 2011 and 2010, the Company repurchased and retired 9.5 million shares, 14 million shares... -
Page 41
... single-serve packages. Increased health consciousness. We believe the main beneficiaries of this trend include diet and low calorie drinks, ready-to-drink teas and bottled waters. Changes in lifestyle. We believe changes in lifestyle will continue to drive increased sales of single-serve beverages... -
Page 42
...The Packaged Beverages segment reflects sales in the U.S. and Canada from the manufacture and distribution of finished beverages and other products, including sales of our own brands and third party brands, through both DSD and WD. The Latin America Beverages segment reflects sales in the Mexico and... -
Page 43
... (the "2012 Notes") at maturity and for general corporate purposes. On January 1, 2013, we launched five new additions (7UP, Sunkist soda, A&W, Canada Dry and RC Cola) to our TEN platform, which uses a unique blend of sweeteners developed by us to achieve a low-calorie option with the full flavor of... -
Page 44
...impact of additional fountain availability. These increases were offset by declines in Cherry and diet Dr Pepper. Canada Dry, 7UP, A&W and Sunkist soda, Sun Drop (our "Core 5 brands") brands were flat compared to the year ago period as a mid single-digit increase in Canada Dry was offset by a double... -
Page 45
... in our net price realization and $15 million of unrealized gains during the year ended December 31, 2012 for the mark-to-market activity on commodity derivative contracts, which were partially offset by higher costs for apples, flavors, apple juice concentrate, packaging, sweeteners and other... -
Page 46
... We report our business in three segments: Beverage Concentrates, Packaged Beverages and Latin America Beverages. The key financial measures management uses to assess the performance of our segments are net sales and SOP. The following tables set forth net sales and SOP for our segments for 2012 and... -
Page 47
...the year ended December 31, 2012, compared with the year ended December 31, 2011. Volume for our Core 5 brands increased 1%, led by a high single-digit increase in Canada Dry, mid single-digit increase in Sunkist soda, as a result of flavor expansion, and a low single-digit increase in A&W. Sun Drop... -
Page 48
... Dr Pepper due to targeted marketing programs. These increases in sales volume were partially offset by a 9% decrease in Aguafiel as a result of lower promotional activity. Net Sales. Net sales decreased $2 million for the year ended December 31, 2012, compared with the year ended December 31, 2011... -
Page 49
... America Beverages segment, Peñafiel and Squirt increased 4% and 3%, respectively. Dr Pepper volume was flat as sales volume in the prior year was driven by higher volumes a year ago caused by low holiday and summer pricing by a national account that did not recur in 2011 and higher retail pricing... -
Page 50
... 2011 was lower than the 60.2% gross margin for the year ended December 31, 2010, primarily due to higher costs for packaging materials, sweeteners, apple juice concentrate and other commodities. The cost of inflation also contributed to a $12 million LIFO inventory provision recorded in the current... -
Page 51
... We report our business in three segments: Beverage Concentrates, Packaged Beverages and Latin America Beverages. The key financial measures management uses to assess the performance of our segments are net sales and SOP. The following tables set forth net sales and SOP for our segments for 2011 and... -
Page 52
... a year ago caused by low holiday and summer pricing by a national account that did not recur in 2011 and higher retail pricing in the second half of 2011. PACKAGED BEVERAGES The following table details our Packaged Beverages segment's net sales and SOP for the year ended December 31, 2011 and 2010... -
Page 53
... driven by price increases. Net Sales. Net sales increased 9% for the year ended December 31, 2011, compared with year ended December 31, 2010, primarily due to favorable product mix, increases in sales volume and price increases. The favorable impact of $7 million in foreign currency changes was... -
Page 54
...and the unsecured credit agreement. Unsecured Credit Agreement On September 25, 2012, the Company entered into a new five-year unsecured credit agreement (the "Credit Agreement"), which provides for a $500 million revolving line of credit (the "Revolver"). Borrowings under the Revolver bear interest... -
Page 55
... by lower proceeds of $15 million from disposal of property, plant and equipment in 2011. NET CASH USED IN FINANCING ACTIVITIES 2012 Net cash used in financing activities for the year ended December 31, 2012 primarily consisted of stock repurchases of $400 million and dividend payments of $284... -
Page 56
... paid for capital expenditures was $193 million for the year ended December 31, 2012. Capital expenditures primarily related to machinery and equipment, plant improvements, expansion and replacement of existing cold drink equipment and our distribution fleet and IT investments. In 2013, we expect to... -
Page 57
... stock. For the years ended December 31, 2012 and 2011, the Company repurchased and retired 9.5 million and 14 million shares of common stock, respectively, valued at approximately $400 million and $522 million, respectively. Refer to Part II, Item 5 "Market for Registrant's Common Equity, Related... -
Page 58
... sales ratably over the estimated 25-year life of the customer relationship. Agreement with The Coca-Cola Company On October 4, 2010, the Company completed the licensing of certain brands to Coca-Cola following Coca-Cola's acquisition of CCE's North American Bottling Business and executed separate... -
Page 59
... factors: (1) the fair value of our goodwill, brands and distribution rights exceeded their carrying amounts by a substantial margin in the 2010 annual impairment analysis performed; (2) our business performance during 2011 was in line with our forecast used to estimate fair value in the impairment... -
Page 60
... or salary increases. Employee benefit plan obligations and expenses included in our Consolidated Financial Statements are determined from actuarial analyses based on plan assumptions, employee demographic data, years of service, compensation, benefits and claims paid and employer contributions. The... -
Page 61
...8, "Financial Statements and Supplementary Data" of this Annual Report on Form 10-K for a discussion of recent accounting standards and pronouncements. ITEM 7A. Quantitative and Qualitative Disclosures About Market Risk. We are exposed to market risks arising from changes in market rates and prices... -
Page 62
... recover increased costs through higher pricing may be limited by the competitive environment in which we operate. Our principal commodities risks relate to our purchases of PET, diesel fuel, corn (for high fructose corn syrup), aluminum, sucrose, apple juice concentrate and natural gas (for use in... -
Page 63
... Financial Statements: Reports of Independent Registered Public Accounting Firm Consolidated Statements of Income for the years ended December 31, 2012, 2011 and 2010 Consolidated Statements of Comprehensive Income for the years ended December 31, 2012, 2011 and 2010 Consolidated Balance Sheets... -
Page 64
... sheets of Dr Pepper Snapple Group, Inc. and subsidiaries (the "Company") as of December 31, 2012 and 2011, and the related consolidated statements of income, comprehensive income, changes in stockholders' equity, and cash flows for each of the three years in the period ended December 31, 2012... -
Page 65
... the internal control over financial reporting of Dr Pepper Snapple Group, Inc. (the "Company") as of December 31, 2012, based on criteria established in Internal Control-Integrated Framework issued by the Committee of Sponsoring Organizations of the Treadway Commission. The Company's management is... -
Page 66
DR PEPPER SNAPPLE GROUP, INC. CONSOLIDATED STATEMENTS OF INCOME For the Years Ended December 31, 2012, 2011 and 2010 (in millions, except per share data) For the Year Ended December 31, Net sales Cost of sales Gross profit Selling, general and administrative expenses Depreciation and amortization ... -
Page 67
DR PEPPER SNAPPLE GROUP, INC. CONSOLIDATED STATEMENTS OF COMPREHENSIVE INCOME For the Years Ended December 31, 2012, 2011 and 2010 (in millions) For the Year Ended December 31, 2012 Net income Other comprehensive income (loss), net of tax: Foreign currency translation adjustments Net change in ... -
Page 68
DR PEPPER SNAPPLE GROUP, INC. CONSOLIDATED BALANCE SHEETS As of December 31, 2012 and 2011 (in millions, except share and per share data) December 31, 2012 Assets Current assets: Cash and cash equivalents Accounts receivable: Trade, net Other Inventories Deferred tax assets Prepaid expenses and ... -
Page 69
DR PEPPER SNAPPLE GROUP, INC. CONSOLIDATED STATEMENTS OF CASH FLOWS For the Years Ended December 31, 2012, 2011 and 2010 (in millions) For the Year Ended December 31, 2011 $ 606 198 34 (65) 34 (498) - 24 (55) (18) 29 (21) 1 (30) 521 - 760 (215) (3) (2) 3 - (217) 1,000 (400) (522) (251) 20 10 (6) ... -
Page 70
... PEPPER SNAPPLE GROUP, INC. CONSOLIDATED STATEMENTS OF CHANGES IN STOCKHOLDERS' EQUITY For the Years Ended December 31, 2012, 2011 and 2010 (In millions, except per share data) Accumulated Common Stock Issued Shares Balance as of January 1, 2010 Shares issued under employee stock-based compensation... -
Page 71
... ready-to-drink teas, juices, juice drinks, mixers and water. The Company's brand portfolio includes popular CSD brands such as Dr Pepper, Canada Dry, 7UP, Squirt, Crush, A&W, Sunkist soda, Peñafiel, Schweppes and Sun Drop, and NCB brands such as Hawaiian Punch, Snapple, Mott's, Clamato, Mr... -
Page 72
... the required allowance for doubtful collections using information such as its customer credit history and financial condition, industry and market segment information, economic trends and conditions and credit reports. Allowances can be affected by changes in the industry, customer credit issues or... -
Page 73
... consumer marketing and promotional support. The Company also considers factors such as its ability to continue to protect the legal rights that arise from these brand names indefinitely or the absence of any regulatory, economic or competitive factors that could truncate the life of the brand name... -
Page 74
... ceases to exist, any associated amounts reported in AOCL are reclassified to earnings at that time. Refer to Note 9 for additional information. Fair Value The fair value of long term debt as of December 31, 2012 and 2011, is based on quoted market prices for publicly traded securities. 56 -
Page 75
...and claims paid and employer contributions. The expense related to the postretirement plans has been determined in accordance with U.S. GAAP and the Company accrues the cost of these benefits during the years that employees render service. Refer to Note 12 for additional information. Risk Management... -
Page 76
... as net sales ratably over the estimated 25-year life of the customer relationship. Customer Marketing Programs and Incentives The Company offers a variety of incentives and discounts to bottlers, customers and consumers through various programs to support the distribution of its products. These... -
Page 77
...expense in the Consolidated Statements of Income related to the fair value of employee share-based awards. Compensation cost is based on the grant-date fair value, which is estimated using the Black-Scholes option pricing model for stock options. The fair value of restricted stock units ("RSUs") and... -
Page 78
... the balance sheet date. All such differences are recorded in results of operations and amounted to $7 million, $8 million and $14 million during the years ended December 31, 2012, 2011 and 2010, respectively. Recently Issued Accounting Standards In December 2011, the Financial Accounting Standards... -
Page 79
DR PEPPER SNAPPLE GROUP, INC. NOTES TO AUDITED CONSOLIDATED FINANCIAL STATEMENTS (Continued) 3. Inventories Inventories as of December 31, 2012, and 2011 consisted of the following (in millions): December 31, 2012 Raw materials Work in process Finished goods Inventories at first in first out cost ... -
Page 80
DR PEPPER SNAPPLE GROUP, INC. NOTES TO AUDITED CONSOLIDATED FINANCIAL STATEMENTS (Continued) During the third quarter of 2010, the Company contributed approximately $1 million to Hydrive Energy, LLC ("Hydrive"), a beverage manufacturer, whose co-founder and significant equity holder was previously ... -
Page 81
... lives increased due to a $4 million change in foreign currency translation. As of December 31, 2012, the weighted average useful life of intangible assets with finite lives was nine years in total, consisting of five years for distribution rights, 10 years for both brands and customer relationships... -
Page 82
...: (1) the fair value of goodwill, brands and distribution rights exceeded their carrying amounts by a substantial margin in the 2010 annual impairment analyses performed; (2) the Company's business performance during 2011 was in line with the forecast used to estimate fair value in the impairment... -
Page 83
DR PEPPER SNAPPLE GROUP, INC. NOTES TO AUDITED CONSOLIDATED FINANCIAL STATEMENTS (Continued) 8. Long-term Obligations and Borrowing Arrangements LONG-TERM OBLIGATIONS The following table summarizes the Company's long-term debt obligations as of December 31, 2012, and 2011 (in millions): December ... -
Page 84
... this facility as of December 31, 2011. Execution of the New Unsecured Credit Agreement On September 25, 2012, the Company entered into a new five-year unsecured credit agreement (the "Credit Agreement"), which provides for a $500 million revolving line of credit (the "Revolver"). Borrowings under... -
Page 85
... 2012 and $7 million remains available for use. 9. Derivatives DPS is exposed to market risks arising from adverse changes in interest rates; foreign exchange rates; and commodity prices affecting the cost of raw materials and fuels. The Company manages these risks through a variety of strategies... -
Page 86
DR PEPPER SNAPPLE GROUP, INC. NOTES TO AUDITED CONSOLIDATED FINANCIAL STATEMENTS (Continued) INTEREST RATES Cash Flow Hedges During the second quarter of 2011, in order to hedge the variability in cash flows from interest rate changes associated with the Company's planned issuances of long-term ... -
Page 87
... of predictability in the Company's overall cost structure. During the years ended December 31, 2012 and 2011, the Company held forward contracts that economically hedged certain of its risks. In these cases, a natural hedging relationship exists in which changes in the fair value of the instruments... -
Page 88
DR PEPPER SNAPPLE GROUP, INC. NOTES TO AUDITED CONSOLIDATED FINANCIAL STATEMENTS (Continued) FAIR VALUE OF DERIVATIVE INSTRUMENTS The following table summarizes the location of the fair value of the Company's derivative instruments within the Consolidated Balance Sheets as of December 31, 2012 and... -
Page 89
... Income Location of Gain (Loss) Reclassified from AOCL into Income There was no hedge ineffectiveness recognized in earnings for the years ended December 31, 2012, 2011 and 2010 with respect to derivative instruments designated as cash flow hedges. During the next 12 months, the Company expects... -
Page 90
... CONSOLIDATED FINANCIAL STATEMENTS (Continued) IMPACT OF FAIR VALUE HEDGES The following table presents the impact of derivative instruments designated as fair value hedging instruments under U.S. GAAP to the Consolidated Statements of Income for the years ended December 31, 2012, 2011 and 2010 (in... -
Page 91
DR PEPPER SNAPPLE GROUP, INC. NOTES TO AUDITED CONSOLIDATED FINANCIAL STATEMENTS (Continued) IMPACT OF ECONOMIC HEDGES The following table presents the impact of derivative instruments not designated as hedging instruments under U.S. GAAP to the Consolidated Statements of Income for the years ... -
Page 92
DR PEPPER SNAPPLE GROUP, INC. NOTES TO AUDITED CONSOLIDATED FINANCIAL STATEMENTS (Continued) 10. Other Non-Current Assets and Other Non-Current Liabilities The table below details the components of other non-current assets and other non-current liabilities as of December 31, 2012 and 2011 (in ... -
Page 93
... FINANCIAL STATEMENTS (Continued) The following is a reconciliation of provision for income taxes computed at the U.S. federal statutory tax rate to the provision for income taxes reported in the Consolidated Statements of Income (in millions): For the Year Ended December 31, 2012 2011 2010... -
Page 94
...Company. The following is a reconciliation of the changes in the gross balance of unrecognized tax benefits for the three years ended December 31, 2012, 2011 and 2010 (in millions): December 31, 2012 Beginning balance Increases related to tax positions taken during the current year Increases related... -
Page 95
... and expenses included in the Company's Audited Consolidated Financial Statements are determined using actuarial analyses based on plan assumptions including employee demographic data such as years of service and compensation, benefits and claims paid and employer contributions, among others. The... -
Page 96
DR PEPPER SNAPPLE GROUP, INC. NOTES TO AUDITED CONSOLIDATED FINANCIAL STATEMENTS (Continued) Financial Statement Impact The total pension and postretirement net periodic benefit costs recorded in the Company's Consolidated Statements of Income for the years ended December 31, 2012, 2011 and 2010 ... -
Page 97
... 2010 2012 2011 2010 Net Periodic Benefit Costs Service cost Interest cost Expected return on assets Amortization of actuarial loss Amortization of prior service credit Curtailments Settlements Net periodic benefit costs Changes Recognized in OCI Curtailment effects Settlement effects Current year... -
Page 98
DR PEPPER SNAPPLE GROUP, INC. NOTES TO AUDITED CONSOLIDATED FINANCIAL STATEMENTS (Continued) The following table summarizes amounts included in AOCL for the plans as of December 31, 2012 and 2011 (in millions): Postretirement Medical Plans 2012 2011 (4) $ (6) $ 7 5 (1) $ 3 $ Prior service cost (... -
Page 99
... rate Expected long-term rate of return on assets Rate of increase in compensation levels Pension Plans 2012 2011 6.12% 7.14% 7.65% 7.91% 4.03% 4.16% 2010 7.04% 7.95% 4.10% The following table summarizes the health care cost trend rate assumptions used to determine the postretirement medical plan... -
Page 100
DR PEPPER SNAPPLE GROUP, INC. NOTES TO AUDITED CONSOLIDATED FINANCIAL STATEMENTS (Continued) The pension assets of DPS' U.S. plans represent approximately 93% of the total pension plan assets as of December 31, 2012. The asset allocation for the U.S. defined benefit pension plans for December 31, ... -
Page 101
... $ - - 5 The Company participates in a number of trustee-managed multi-employer defined benefit pension plans for union-represented employees under certain collective bargaining agreements. The risks of participating in these multi-employer plans are different from single-employer plans due to the... -
Page 102
DR PEPPER SNAPPLE GROUP, INC. NOTES TO AUDITED CONSOLIDATED FINANCIAL STATEMENTS (Continued) Contributions paid into the multi-employer plans are expensed as incurred and were as follows for the years ended December 31, 2012, 2011 and 2010 (in millions): For the Year Ended December 31, 2012 2011 ... -
Page 103
...-tax contributions under the SIP are limited by the Code compensation limitations. The Company's employer matching contributions to the SIP and SSP plans were approximately $15 million in 2012 and $14 million in 2011 and 2010. Additionally, current participants in the SIP and SSP are eligible for... -
Page 104
... from information available in publicly quoted markets. The fair value of commodity forward contracts are valued using the market approach based on observable market transactions, primarily swap agreements, at the reporting date. Interest rate swap contracts are valued using models based primarily... -
Page 105
DR PEPPER SNAPPLE GROUP, INC. NOTES TO AUDITED CONSOLIDATED FINANCIAL STATEMENTS (Continued) There were no transfers of financial instruments between the three levels of fair value hierarchy during the years ended December 31, 2012, 2011 and 2010. FAIR VALUE OF PENSION AND POSTRETIREMENT PLAN ... -
Page 106
DR PEPPER SNAPPLE GROUP, INC. NOTES TO AUDITED CONSOLIDATED FINANCIAL STATEMENTS (Continued) Fair Value Measurements at December 31, 2011 Quoted Prices in Significant Significant Active Markets for Observable Unobservable Identical Assets Inputs Inputs (Level 1) (Level 2) (Level 3) Total Assets: ... -
Page 107
... PEPPER SNAPPLE GROUP, INC. NOTES TO AUDITED CONSOLIDATED FINANCIAL STATEMENTS (Continued) The following tables present the major categories of plan assets and the respective fair value hierarchy for the postretirement medical plan assets as of December 31, 2012, and 2011 (in millions): Fair Value... -
Page 108
..., 2012 and 2011, were based on current market rates available to the Company (Level 2 inputs). The difference between the fair value and the carrying value represents the theoretical net premium or discount that would be paid or received to retire all debt at such date. 14. Stock-Based Compensation... -
Page 109
... term of 10 years. STOCK OPTIONS The tables below summarize information about the Company's stock options granted during the years ended December 31, 2012, 2011 and 2010. The fair value of each stock option is estimated on the date of grant using the Black-Scholes option-pricing model. The riskfree... -
Page 110
... CONSOLIDATED FINANCIAL STATEMENTS (Continued) RESTRICTED STOCK UNITS AND PERFORMANCE SHARE UNITS In 2011, the Compensation Committee of the Board approved a PSU plan. Each PSU is equivalent in value to one share of the Company's common stock. PSUs will vest three years from the beginning date of... -
Page 111
DR PEPPER SNAPPLE GROUP, INC. NOTES TO AUDITED CONSOLIDATED FINANCIAL STATEMENTS (Continued) During 2009, 2010 and 2011, the Board authorized a total aggregate share repurchase plan of $3 billion. The Company repurchased and retired 9.5 million shares of common stock valued at approximately $400 ... -
Page 112
...Cadbury Schweppes Bottling Group, Inc. (now The American Bottling Company), et al., as defendants. The defendants are subsidiaries of the Company. The complaint related to activities which principally occurred before the Company's spin off from Cadbury in 2008. On December 7, 2011, the jury returned... -
Page 113
... the Company's own brands and third party brands, through both DSD and WD. The Latin America Beverages segment reflects sales in the Mexico and Caribbean markets from the manufacture and distribution of concentrates, syrup and finished beverages. • Segment results are based on management reports... -
Page 114
DR PEPPER SNAPPLE GROUP, INC. NOTES TO AUDITED CONSOLIDATED FINANCIAL STATEMENTS (Continued) For the Year Ended December 31, 2012 Segment Results - SOP Beverage Concentrates Packaged Beverages Latin America Beverages Total SOP Unallocated corporate costs Other operating expense, net Income from ... -
Page 115
DR PEPPER SNAPPLE GROUP, INC. NOTES TO AUDITED CONSOLIDATED FINANCIAL STATEMENTS (Continued) As of December 31, 2012 2011 Total assets Property, plant and equipment Beverage Concentrates Packaged Beverages Latin America Beverages Segment total Corporate and other Property, plant and equipment, net... -
Page 116
... present the financial information for the years ended December 31, 2012, 2011 and 2010, and as of December 31, 2012, and 2011, for Dr Pepper Snapple Group, Inc. (the "Parent"), Guarantors and Non-Guarantors. The consolidating schedules are provided in accordance with the reporting requirements for... -
Page 117
DR PEPPER SNAPPLE GROUP, INC. NOTES TO AUDITED CONSOLIDATED FINANCIAL STATEMENTS (Continued) Condensed Consolidating Statements of Income For the Year Ended December 31, 2011...925 320 605 - 1 606 Net sales Cost of sales Gross profit Selling, general and administrative expenses Depreciation and ... -
Page 118
DR PEPPER SNAPPLE GROUP, INC. NOTES TO AUDITED CONSOLIDATED FINANCIAL STATEMENTS (Continued) Condensed Consolidating Statements of Income For the Year Ended December 31, 2010...821 294 527 - 1 528 Net sales Cost of sales Gross profit Selling, general and administrative expenses Depreciation and ... -
Page 119
DR PEPPER SNAPPLE GROUP, INC. NOTES TO AUDITED CONSOLIDATED FINANCIAL STATEMENTS (Continued) Condensed Consolidating Statements of Comprehensive Income For the Year Ended December 31, 2012 NonGuarantors Guarantors Eliminations Total (725) $ $ 647 $ 78 $ 629 Net income Other comprehensive income (... -
Page 120
DR PEPPER SNAPPLE GROUP, INC. NOTES TO AUDITED CONSOLIDATED FINANCIAL STATEMENTS (Continued) Condensed Consolidating Balance Sheets As of December 31, 2012 ...Related party receivable Inventories Deferred tax assets Prepaid expenses and other current assets Total current assets Property, plant... -
Page 121
DR PEPPER SNAPPLE GROUP, INC. NOTES TO AUDITED CONSOLIDATED FINANCIAL STATEMENTS (Continued) Condensed Consolidating Balance Sheets As of December 31, 2011 NonGuarantors ...Related party receivable Inventories Deferred tax assets Prepaid and other current assets Total current assets Property, plant... -
Page 122
DR PEPPER SNAPPLE GROUP, INC. NOTES TO AUDITED CONSOLIDATED FINANCIAL STATEMENTS (Continued) Condensed Consolidating Statements of Cash Flows For the Year Ended December 31, 2012 NonGuarantors Guarantors Eliminations Parent Operating activities: Net cash (used in) provided by operating activities ... -
Page 123
DR PEPPER SNAPPLE GROUP, INC. NOTES TO AUDITED CONSOLIDATED FINANCIAL STATEMENTS (Continued) Condensed Consolidating Statements of Cash Flows For the Year Ended December 31, 2011 NonGuarantors Guarantors Eliminations Parent Operating activities: Net cash (used in) provided by operating activities ... -
Page 124
DR PEPPER SNAPPLE GROUP, INC. NOTES TO AUDITED CONSOLIDATED FINANCIAL STATEMENTS (Continued) Condensed Consolidating Statements of Cash Flows For the Year Ended December 31, 2010 NonGuarantors Guarantors Eliminations Parent Operating activities: Net cash (used in) provided by operating activities ... -
Page 125
... 25-year life of the customer relationship. 22. Agreement with Coca-Cola On October 4, 2010, the Company completed the licensing of certain brands to Coca-Cola following Coca-Cola's acquisition of Coca-Cola Enterprises' ("CCE") North American Bottling Business and executed separate agreements... -
Page 126
... information on net sales, gross profit, net income, earnings per share and other quarterly financial data by quarter for the years ended December 31, 2012, and 2011. This data, with the exception of the common stock prices, was derived from the Company's unaudited consolidated financial statements... -
Page 127
... registered public accounting firm, as stated in their attestation report, which is included in Item 8, "Financial Statements and Supplementary Data," of this Annual Report on Form 10-K. CHANGES IN INTERNAL CONTROL OVER FINANCIAL REPORTING As of December 31, 2012, management has concluded... -
Page 128
...Sheets as of December 31, 2012, and 2011 Consolidated Statements of Cash Flows for the years ended December 31, 2012, 2011 and 2010 Consolidated Statements of Changes in Stockholders' Equity for the years ended December 31, 2012, 2011 and 2010 Notes to Consolidated Financial Statements for the years... -
Page 129
EXHIBIT INDEX 2.1 Separation and Distribution Agreement between Cadbury Schweppes plc and Dr Pepper Snapple Group, Inc. and, solely for certain provisions set forth therein, Cadbury plc, dated as of May 1, 2008 (filed as Exhibit 2.1 to the Company's Current Report on Form 8-K (filed on May 5, 2008) ... -
Page 130
... of $250,000,000 (filed as Exhibit 4.3 to the Company's Current Report on Form 8-K (filed on November 20, 2012) and incorporated herein by reference). Transition Services Agreement between Cadbury Schweppes plc and Dr Pepper Snapple Group, Inc., dated as of May 1, 2008 (initially filed as Exhibit 10... -
Page 131
... Lynch, Pierce, Fenner & Smith Incorporated, as joint book-running managers and on behalf of the other underwriters named therein, and Dr Pepper Snapple Group, Inc. (filed as Exhibit 10.1 to the Company's Current Report on Form 8-K (filed on November 14, 2012) and incorporated herein by reference... -
Page 132
... Code. 101* The following financial information from Dr Pepper Snapple Group, Inc.'s Annual Report on Form 10-K for the year ended December 31, 2012, formatted in XBRL (eXtensible Business Reporting Language): (i) Consolidated Statements of Income for the years ended December 31, 2012, 2011 and 2010... -
Page 133
... has duly caused this report to be signed on its behalf by the undersigned thereunto duly authorized. Dr Pepper Snapple Group, Inc. By: Date: February 20, 2013 Name: Title: /s/ Martin M. Ellen Martin M. Ellen Executive Vice President and Chief Financial Officer Pursuant to the requirements... -
Page 134
... D. Martin Terence D. Martin Director By: Date: February 20, 2013 Name: Title: /s/ Pamela H. Patsley Pamela H. Patsley Director By: Date: February 20, 2013 Name: Title: /s/ Joyce M. Roché Joyce M. Roché Director By: Date: February 20, 2013 Name: Title: /s/ Ronald G. Rogers Ronald G. Rogers... -
Page 135
... the investor relations department at corporate headquarters or via the investor center section of the website at www.drpeppersnapple.com. Corporate Headquarters Dr Pepper Snapple Group, Inc. 5301 Legacy Drive Plano, TX 75024 (972) 673-7000 www.drpeppersnapple.com Common Stock The Company's Class...