Snapple 2008 Annual Report Download - page 10
Download and view the complete annual report
Please find page 10 of the 2008 Snapple annual report below. You can navigate through the pages in the report by either clicking on the pages listed below, or by using the keyword search tool below to find specific information within the annual report.-
 1
1 -
 2
2 -
 3
3 -
 4
4 -
 5
5 -
 6
6 -
 7
7 -
 8
8 -
 9
9 -
 10
10 -
 11
11 -
 12
12 -
 13
13 -
 14
14 -
 15
15 -
 16
16 -
 17
17 -
 18
18 -
 19
19 -
 20
20 -
 21
21 -
22
-
23
-
24
-
25
-
26
-
27
-
28
-
29
-
30
-
31
-
32
-
33
-
34
-
35
-
36
-
37
-
38
-
39
-
40
-
41
-
42
-
43
-
44
-
45
-
46
-
47
-
48
-
49
-
50
-
51
-
52
-
53
-
54
-
55
-
56
-
57
-
58
-
59
-
60
-
61
-
62
-
63
-
64
-
65
-
66
-
67
-
68
-
69
-
70
-
71
-
72
-
73
-
74
-
75
-
76
-
77
-
78
-
79
-
80
-
81
-
82
-
83
-
84
-
85
-
86
-
87
-
88
-
89
-
90
-
91
-
92
-
93
-
94
-
95
-
96
-
97
-
98
-
99
-
100
-
101
-
102
-
103
-
104
-
105
-
106
-
107
-
108
-
109
-
110
-
111
-
112
-
113
-
114
-
115
-
116
-
117
-
118
-
119
-
120
-
121
-
122
-
123
-
124
-
125
-
126
-
127
-
128
-
129
-
130
-
131
-
132
-
133
-
134
-
135
-
136
-
137
-
138
-
139
-
140
-
141
-
142
-
143
-
144
-
145
-
146
-
147
-
148
-
149
-
150
 |
 |

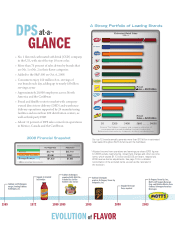
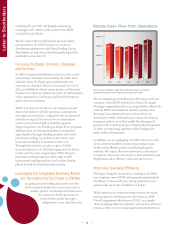
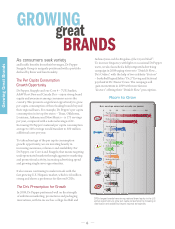
As consumers seek variety
and health bene ts from their beverages, Dr Pepper
Snapple Group is uniquely positioned with a portfolio
de ned by avor and functionality.
The Per Capita Consumption
Growth Opportunity
Dr Pepper, Snapple and our Core 4 – 7UP, Sunkist,
A&W Root Beer and Canada Dry – enjoy strong brand
equity and awareness among consumers across the
country. is presents a signi cant opportunity to grow
per capita consumption of these leading brands beyond
their regional bases. For example, Dr Pepper’s per capita
consumption in its top ve states – Texas, Oklahoma,
Louisiana, Arkansas and New Mexico – is 173 servings
per year, compared with a national average of 62.
Increasing Dr Pepper’s national per capita consumption
average to 100 servings would translate to 300 million
additional cases per year.
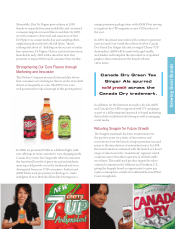
To take advantage of the per capita consumption
growth opportunity, we are investing heavily in
increasing awareness, relevance and availability. For
Dr Pepper, our Core 4 and Snapple, that means targeting
underpenetrated markets through aggressive marketing
and promotional activity, increasing advertising spend
and growing single serve opportunities.
It also means continuing to make inroads with the
fast-growing U.S. Hispanic market, which is 45 million
strong and shows a preference for avored CSDs.
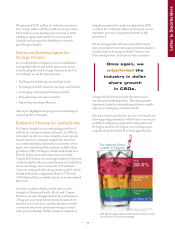
The Dr’s Prescription for Growth
In 2008, Dr Pepper performed well on the strength
of ambitious marketing, promotions and packaging
innovations, with tie-ins such as college football and
Indiana Jones and the Kingdom of the Crystal Skull™.
To increase frequency with light or occasional Dr Pepper
users, we also launched a fully integrated advertising
campaign in 2008 urging viewers to “Drink It Slow…
Dr’s Orders,” with the help of two celebrity “doctors”
– basketball legend Julius “Dr. J” Erving and ctional
psychiatrist Dr. Frasier Crane. e campaign will
gain momentum in 2009 with more famous
“doctors” o ering their “Drink It Slow” prescription.
GROWING
great
BRANDS
6
Growing Great Brands
DPS’s largest brands have strong national brand equity in the U.S.
and an opportunity to grow per capita consumption by focusing on
distribution and availability beyond regional strongholds.