Samsung 2001 Annual Report Download - page 60
Download and view the complete annual report
Please find page 60 of the 2001 Samsung annual report below. You can navigate through the pages in the report by either clicking on the pages listed below, or by using the keyword search tool below to find specific information within the annual report.-
 1
1 -
2
-
3
-
4
-
5
-
6
-
7
-
8
-
9
-
10
-
11
-
12
-
13
-
14
-
15
-
16
-
17
-
18
-
19
-
20
-
21
-
22
-
23
-
24
-
25
-
26
-
27
-
28
-
29
-
30
-
31
-
32
-
33
-
34
-
35
-
36
-
37
-
38
-
39
-
40
-
41
-
42
-
43
-
44
-
45
-
46
-
47
-
48
-
49
-
 50
50 -
 51
51 -
 52
52 -
 53
53 -
 54
54 -
 55
55 -
 56
56 -
 57
57 -
 58
58 -
 59
59 -
 60
60 -
 61
61 -
 62
62 -
 63
63 -
 64
64 -
 65
65 -
 66
66 -
 67
67 -
 68
68 -
 69
69 -
 70
70 -
71
 |
 |

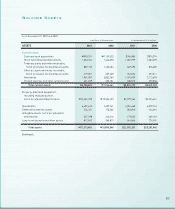
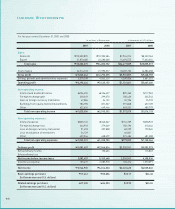
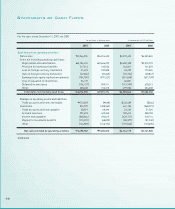
58
2001 2000 2001 2000
Sales:
Domestic ₩10,509,895 ₩10,903,384 $7,926,014 $8,222,763
Export 21,870,480 23,380,368 16,493,575 17,632,254
Total sales ₩32,380,375 ₩34,283,752 $24,419,589 $25,855,017
Cost of sales 24,514,733 21,993,377 18,487,732 16,586,258
Gross profit ₩7,865,642 ₩12,290,375 $5,931,857 $9,268,759
Selling, general and administrative expenses 5,570,308 4,855,220 4,200,836 3,661,553
Operating profit ₩2,295,334 ₩7,435,155 $1,731,021 $5,607,206
Non-operating income:
Interest and dividend income ₩126,455 ₩156,427 $95,365 $117,969
Foreign exchange gain 239,249 299,070 180,429 225,543
Gain on foreign currency translation 47,386 34,122 35,736 25,733
Earnings from equity-method investments 784,790 871,327 591,848 657,109
Other 622,624 649,446 469,551 489,779
Total non-operating income ₩1,820,504 ₩2,010,392 $1,372,929 $1,516,133
Non-operating expenses:
Interest expense ₩205,145 ₩343,367 $154,709 $258,949
Foreign exchange loss 242,918 279,049 183,196 210,444
Loss on foreign currency translation 91,493 237,838 68,999 179,365
Loss on valuation of inventories 54,129 -40,821 -
Other 439,546 638,479 331,484 481,508
Total non-operating expenses ₩1,033,231 ₩1,498,733 $779,209 $1,130,266
Ordinary profit ₩3,082,607 ₩7,946,814 $2,324,741 $5,993,073
Extraordinary income - 153,634 - 115,863
Extraordinary loss - - - -
Net income before income taxes 3,082,607 8,100,448 2,324,741 6,108,936
Income tax expense 135,672 2,085,918 102,316 1,573,091
Net income ₩2,946,935 ₩6,014,530 $2,222,425 $4,535,845
Basic earnings per share ₩17,461 ₩35,006 $13.17 $26.40
(in Korean won and U.S. dollars)
Diluted earnings per share ₩17,230 ₩34,393 $12.99 $25.94
(In Korean won and U.S. dollars)
Income Statements
For the years ended December 31, 2001 and 2000
In millions of Korean won In thousands of U.S. dollars