Samsung 2001 Annual Report Download - page 4
Download and view the complete annual report
Please find page 4 of the 2001 Samsung annual report below. You can navigate through the pages in the report by either clicking on the pages listed below, or by using the keyword search tool below to find specific information within the annual report.-
 1
1 -
 2
2 -
 3
3 -
 4
4 -
 5
5 -
 6
6 -
 7
7 -
 8
8 -
 9
9 -
 10
10 -
 11
11 -
 12
12 -
 13
13 -
 14
14 -
 15
15 -
16
-
17
-
18
-
19
-
20
-
21
-
22
-
23
-
24
-
25
-
26
-
27
-
28
-
29
-
30
-
31
-
32
-
33
-
34
-
35
-
36
-
37
-
38
-
39
-
40
-
41
-
42
-
43
-
44
-
45
-
46
-
47
-
48
-
49
-
50
-
51
-
52
-
53
-
54
-
55
-
56
-
57
-
58
-
59
-
60
-
61
-
62
-
63
-
64
-
65
-
66
-
67
-
68
-
69
-
70
-
71
 |
 |

Jan 13 Eleven products win iF Product Design Awards Jan 18 0.15-micron 512Mb NAND flash memory debuts Jan 19 Mobile phone shipments
02
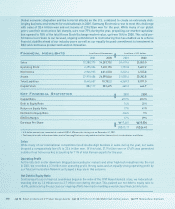
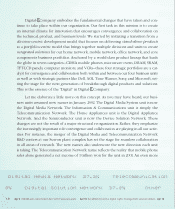
Global economic stagnation and the terrorist attacks on the U.S. combined to create an extremely chal-
lenging business environment for multinationals in 2001. Samsung Electronics rose to meet this challenge
with sales of 32.4 trillion won and net income of 2.9 trillion won for the year. While many of our global
peers saw their stock prices fall sharply, ours rose 77% during the year, propelling our market capitaliza-
tion upward to 18% of the total Korea Stock Exchange market value, up from 14% in 2000. This solid per-
formance is a tribute to our focused, ongoing commitment to restructuring that has enabled us to achieve
financial stability ahead of our industry peers as well as our equally focused commitment to investment in
R&D and continuous product and solution innovation.
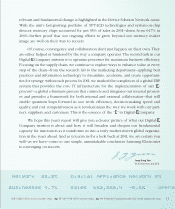
Financial Highlights
2001 2000
Capital Ratio 69.7% 60.2%
Debt to Equity Ratio 14% 25%
Return on Equity Ratio 17% 41%
Net Debt to Equity Ratio -0.6% 9%
EBITDA Margin 17% 29%
Earnings Per Share ₩17,461 ₩35,006
US$13.17 US$26.40
Key Financial Statistics
Sales
While many of our international competitors faced double-digit declines in sales during the year, our sales
dropped a comparatively low 6% to 32.4 trillion won. Of this total, 21.9 trillion won or 67.6% was generated
outside of our home market, accounting for 11% of total Korean exports for the year.
Operating Profit
As the info-tech sector downturn dragged semiconductor makers and other high-tech industries into the red
in 2001, we recorded a 2.3 trillion won operating profit. Strong sales and an equally strong operating profit by
our Telecommunication Network unit played a key role in this outcome.
Net Debt to Equity Ratio
Continuing a focus on financial soundness begun in the wake of the 1997 Asian financial crisis, we reduced out-
standing debt by 1.4 trillion won to 2.7 trillion won during the year. This pushed our net debt to equity ratio to
-0.6%, underscoring the success our ongoing efforts have had in building a world-class financial structure.
In millions of Korean won In millions of U.S. dollars
2001 2000 2001 2000
Sales 32,380,375 34,283,752 24,419.6 25,855.0
Operating Profit 2,295,334 7,435,155 1,731.0 5,607.2
Net Income 2,946,935 6,014,530 2,222.4 4,535.8
Assets 27,919,406 26,895,046 21,055.4 20,282.8
Total Liabilities 8,445,657 10,702.2 6,369.3 8,071.0
Capital Stock 882,117 881,675 665.2 664.9
•U.S. dollar amounts are converted at a rate of US$1=1,326 won, the closing rate on December 31, 2001.
•The financial results in the above tables are for Samsung Electronics only and do not reflect the results of its subsidiaries or affiliates.