Samsung 2001 Annual Report Download - page 59
Download and view the complete annual report
Please find page 59 of the 2001 Samsung annual report below. You can navigate through the pages in the report by either clicking on the pages listed below, or by using the keyword search tool below to find specific information within the annual report.-
 1
1 -
2
-
3
-
4
-
5
-
6
-
7
-
8
-
9
-
10
-
11
-
12
-
13
-
14
-
15
-
16
-
17
-
18
-
19
-
20
-
21
-
22
-
23
-
24
-
25
-
26
-
27
-
28
-
29
-
30
-
31
-
32
-
33
-
34
-
35
-
36
-
37
-
38
-
39
-
40
-
41
-
42
-
43
-
44
-
45
-
46
-
47
-
48
-
 49
49 -
 50
50 -
 51
51 -
 52
52 -
 53
53 -
 54
54 -
 55
55 -
 56
56 -
 57
57 -
 58
58 -
 59
59 -
 60
60 -
 61
61 -
 62
62 -
 63
63 -
 64
64 -
 65
65 -
 66
66 -
 67
67 -
 68
68 -
 69
69 -
70
-
71
 |
 |

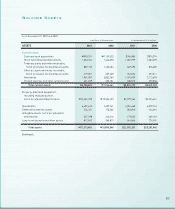
57
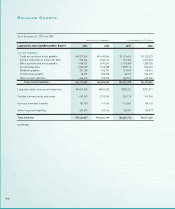
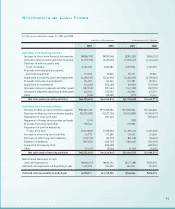
LIABILITIES AND SHAREHOLDERS’ EQUITY 2001 2000 2001 2000
Shareholders’ equity:
Capital stock:
Common stock ₩762,650 ₩762,208 $575,151 $574,817
Preferred stock 119,467 119,467 90,096 90,096
Capital surplus:
Paid-in capital in excess of par value 3,848,792 3,843,443 2,902,558 2,898,524
Other capital surplus 1,843,458 1,843,211 1,390,240 1,390,053
Retained earnings: 13,352,987 10,754,427 10,070,126 8,110,429
(Net income ₩2,946,935 million
in 2001 and ₩6,014,530 million in 2000)
Capital adjustments:
Treasury stock (962,248)(962,248)(725,677)(725,677)
Other 508,643 (167,661)383,591 (126,442)
Total shareholders’ equity ₩19,473,749 ₩16,192,847 $14,686,085 $12,211,800
Total liabilities and shareholders’ equity ₩27,919,406 ₩26,895,046 $21,055,359 $20,282,840
Balance Sheets
As of December 31, 2001 and 2000
In millions of Korean won In thousands of U.S. dollars