Salesforce.com 2005 Annual Report Download - page 47
Download and view the complete annual report
Please find page 47 of the 2005 Salesforce.com annual report below. You can navigate through the pages in the report by either clicking on the pages listed below, or by using the keyword search tool below to find specific information within the annual report.-
 1
1 -
2
-
3
-
4
-
5
-
6
-
7
-
8
-
9
-
10
-
11
-
12
-
13
-
14
-
15
-
16
-
17
-
18
-
19
-
20
-
21
-
22
-
23
-
24
-
25
-
26
-
27
-
28
-
29
-
30
-
31
-
32
-
33
-
34
-
35
-
36
-
 37
37 -
 38
38 -
 39
39 -
 40
40 -
 41
41 -
 42
42 -
 43
43 -
 44
44 -
 45
45 -
 46
46 -
 47
47 -
 48
48 -
 49
49 -
 50
50 -
 51
51 -
 52
52 -
 53
53 -
 54
54 -
 55
55 -
 56
56 -
 57
57 -
58
-
59
-
60
-
61
-
62
-
63
-
64
-
65
-
66
-
67
-
68
-
69
-
70
-
71
-
72
-
73
-
74
-
75
-
76
-
77
-
78
-
79
-
80
-
81
-
82
-
83
-
84
-
85
-
86
-
87
-
88
-
89
-
90
-
91
-
92
-
93
-
94
-
95
-
96
-
97
-
98
-
99
-
100
-
101
-
102
-
103
-
104
-
105
-
106
-
107
-
108
-
109
-
110
-
111
-
112
-
113
-
114
-
115
-
116
-
117
-
118
-
119
-
120
-
121
-
122
-
123
-
124
-
125
-
126
-
127
-
128
-
129
-
130
-
131
-
132
-
133
-
134
-
135
-
136
-
137
-
138
-
139
-
140
-
141
-
142
-
143
-
144
-
145
-
146
-
147
-
148
-
149
-
150
-
151
-
152
-
153
-
154
-
155
-
156
-
157
-
158
-
159
-
160
-
161
-
162
-
163
-
164
-
165
-
166
-
167
-
168
-
169
-
170
-
171
-
172
-
173
-
174
-
175
-
176
-
177
-
178
-
179
-
180
-
181
-
182
-
183
-
184
-
185
-
186
-
187
-
188
-
189
-
190
-
191
-
192
-
193
-
194
-
195
-
196
-
197
-
198
-
199
-
200
-
201
-
202
-
203
-
204
-
205
-
206
-
207
-
208
-
209
-
210
-
211
-
212
-
213
-
214
-
215
-
216
-
217
-
218
-
219
-
220
-
221
-
222
-
223
-
224
-
225
-
226
-
227
-
228
-
229
-
230
-
231
-
232
-
233
-
234
-
235
-
236
-
237
-
238
 |
 |

Table of Contents
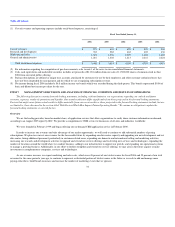
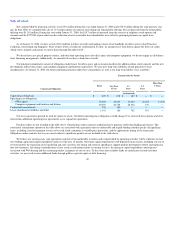
during the same period a year ago, an increase of $17.7 million. The increase was primarily due to an increase of $22.2 million in employee-related costs, $4.1
million in professional and outside service costs and $4.5 million in infrastructure-related costs, which were offset by $15.0 million in increased allocated
charges to non-general and administrative departments. Our general and administrative headcount increased by 69 percent since January 31, 2005 as we added
personnel to support our growth.
Lease Recovery. The lease recovery of $285,000, which occurred during the first quarter of fiscal 2006, was due to the reduction in accruals associated
with the San Francisco, California office space that we abandoned in December 2001. In March 2005, we entered into an agreement with our primary landlord
that released us from a portion of the future obligations associated with the remaining space abandoned in exchange for an agreement to lease additional space
elsewhere in the building at fair value. Accordingly, we recorded a $285,000 credit to reflect the reversal of a portion of the accrual that was directly related to
this space.
Operating Income. Operating income during the year ended January 31, 2006 was $20.1 million. During the same period a year ago, it was $6.5
million. The increase was primarily due to the increase in revenues, most of which was re-invested in an effort to expand our business.
Interest Income. Interest income consists of investment income on cash and marketable securities balances. During the year ended January 31, 2005,
interest income also included the interest income on outstanding loans made to individuals who early exercised their stock options. None of these individuals
was an executive officer or director of the Company and all of them repaid their loan balances by February 28, 2005. Interest income was $7.7 million during
the year ended January 31, 2006 and was $2.7 million during the same period a year ago. The increase was primarily due to increased marketable securities
balances resulting from the $113.8 million of net proceeds from the sale of our common stock in our initial public offering in June 2004 and the cash
generated by operating activities since January 31, 2005.
Benefit (Provision) for Income Taxes. We recorded a benefit for income taxes of $1.3 million during the year ended January 31, 2006, compared to a
provision for income taxes of $1.2 million during the same period a year ago. Included in the $1.3 million benefit for income taxes was a partial reversal of
the valuation allowance related to certain of our deferred tax assets totaling $7.2 million. Prior to fiscal 2006, we recorded a full valuation allowance to
reserve for the benefit of our deferred tax assets due to the uncertainty surrounding our ability to realize these assets. As of January 31, 2006, we had $7.2
million of deferred tax assets, net of deferred tax liabilities, on our consolidated balance sheet.
As of the same date, the Company continues to maintain a $41.8 million valuation allowance against the deferred tax assets attributable to employee
stock option exercises and operating losses from certain foreign subsidiaries. Future reductions in the valuation allowance related to employee stock option
activity, which was approximately $40.0 million of the total valuation allowance as of January 31, 2006, will be recorded to additional paid-in-capital. To
realize the deferred tax assets related to foreign operations, pretax income in those jurisdictions must increase sufficiently to allow management to assume that
such deferred tax assets will be utilized. Historic profits in those jurisdictions have proven insufficient to allow us to absorb deferred tax assets incurred to
date.
Without the reduction in our valuation allowance, the effective tax rate for fiscal 2006 would have been approximately 20 percent. This effective tax
rate differs from the statutory rate primarily due to the utilization of previously unrecognized domestic loss carryovers offset by losses in certain foreign
jurisdictions for which no benefit was recognized.
We currently believe that our fiscal 2007 effective tax rate will be significantly higher than in fiscal 2006. Our future effective tax rate is based on the
projected mix of full-year income in each tax jurisdiction in which we operate, the related income tax expense in each jurisdiction and the impact of the new
accounting requirement to expense stock options. The estimated effective income tax rate is also adjusted for taxes related to significant unusual items. These
actual results could vary from those projected.
43