Ryanair 2010 Annual Report Download - page 11
Download and view the complete annual report
Please find page 11 of the 2010 Ryanair annual report below. You can navigate through the pages in the report by either clicking on the pages listed below, or by using the keyword search tool below to find specific information within the annual report.-
 1
1 -
 2
2 -
 3
3 -
 4
4 -
 5
5 -
 6
6 -
 7
7 -
 8
8 -
 9
9 -
 10
10 -
 11
11 -
 12
12 -
 13
13 -
 14
14 -
 15
15 -
 16
16 -
 17
17 -
 18
18 -
 19
19 -
 20
20 -
 21
21 -
 22
22 -
23
-
24
-
25
-
26
-
27
-
28
-
29
-
30
-
31
-
32
-
33
-
34
-
35
-
36
-
37
-
38
-
39
-
40
-
41
-
42
-
43
-
44
-
45
-
46
-
47
-
48
-
49
-
50
-
51
-
52
-
53
-
54
-
55
-
56
-
57
-
58
-
59
-
60
-
61
-
62
-
63
-
64
-
65
-
66
-
67
-
68
-
69
-
70
-
71
-
72
-
73
-
74
-
75
-
76
-
77
-
78
-
79
-
80
-
81
-
82
-
83
-
84
-
85
-
86
-
87
-
88
-
89
-
90
-
91
-
92
-
93
-
94
-
95
-
96
-
97
-
98
-
99
-
100
-
101
-
102
-
103
-
104
-
105
-
106
-
107
-
108
-
109
-
110
-
111
-
112
-
113
-
114
-
115
-
116
-
117
-
118
-
119
-
120
-
121
-
122
-
123
-
124
-
125
-
126
-
127
-
128
-
129
-
130
-
131
-
132
-
133
-
134
-
135
-
136
-
137
-
138
-
139
-
140
-
141
-
142
-
143
-
144
-
145
-
146
-
147
-
148
-
149
-
150
-
151
-
152
-
153
-
154
-
155
-
156
-
157
-
158
-
159
-
160
-
161
-
162
-
163
-
164
-
165
-
166
-
167
-
168
-
169
-
170
-
171
-
172
-
173
-
174
-
175
-
176
-
177
-
178
-
179
-
180
-
181
-
182
-
183
-
184
-
185
-
186
-
187
-
188
-
189
-
190
-
191
-
192
-
193
-
194
-
195
-
196
-
197
-
198
 |
 |

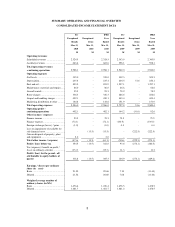
9
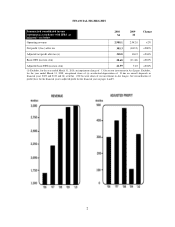
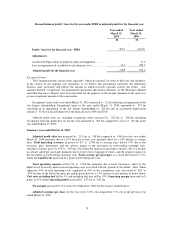
Reconciliation of profit / (loss) for the year under IFRS to adjusted profit for the financial year
Year ended
March 31,
2010
Year ended
March 31,
2009
1M 1M
Profit / (loss) for the financial year - IFRS 305.3
(169.2)
Adjustments
Accelerated depreciation on property, plant and equipment...............
-
51.6
Loss on impairment of available for sale financial asset ....................
13.5
222.5
Adjusted profit for the financial year 318.8
104.9
Exceptional items
The Company presents certain items separately, which are unusual, by virtue of their size and incidence,
in the context of our ongoing core operations, as we believe this presentation represents the underlying
business more accurately and reflects the manner in which investors typically analyse the results. Any
amounts deemed “exceptional” for management discussion and analysis purposes, in the Chairman’s Report
and Chief Executive’s Report, have been classified for the purposes of the income statement in the same way
as non-exceptional amounts of the same nature.
Exceptional items in the year ended March 31, 2010 amounted to 113.5m reflecting an impairment of the
Aer Lingus shareholding. Exceptional items in the year ended March 31, 2009 amounted to 1274.1m
consisting of an impairment of the Aer Lingus shareholding of 1222.5m and an accelerated depreciation
charge of 151.6m on aircraft disposed in the financial years 2009 and 2010.
Adjusted profit after tax excluding exceptional items increased by 1213.9m to 1318.8m. Including
exceptional items the profit after tax for the year amounted to 1305.3m compared to a loss of 1169.2m in the
year ended March 31, 2009.
Summary year ended March 31, 2010
Adjusted profit after tax increased by 1213.9m to 1318.8m compared to 1104.9m in the year ended
March 31, 2009 primarily due to a 29% decrease in fuel costs, partially offset by a 13% decline in average
fares. Total operating revenues increased by 2% to 12,988.1m as average fares fell by 13% due to the
recession, price promotions, and the adverse impact of the movement in euro/sterling exchange rates.
Ancillary revenues grew by 11% to 1663.6m, lower than the increase in passenger volumes, due to a decline
in average spend per passenger primarily due to lower excess baggage revenues, and the negative impact of
the movement in euro/sterling exchange rates. Total revenue per passenger as a result decreased by 11%,
whilst the Load Factor increased by 1 point to 82% during the year.
Total operating expenses fell by 8% to 12,586.0m, primarily due to lower fuel prices, offset by the
higher level of activity and increased operating costs associated with the growth of the airline. Fuel, which
represents 35% of total operating costs compared to 45% in the comparative year, decreased by 29% to
1893.9m due to the fall in the price per gallon paid offset by a 13% increase in the number of hours flown.
Unit costs excluding fuel fell by 3% and including fuel they fell by 19%. Operating margin increased by 8
points to 13% whilst operating profit increased by 1257.9m to 1402.1m.
Net margins increased to 11% from 4% at March 31, 2009 for the reasons outlined above.
Adjusted earnings per share for the year were 21.59 cent compared to 7.10 cent in the previous year
ended March 31, 2009.