Royal Caribbean Cruise Lines 2013 Annual Report Download - page 62
Download and view the complete annual report
Please find page 62 of the 2013 Royal Caribbean Cruise Lines annual report below. You can navigate through the pages in the report by either clicking on the pages listed below, or by using the keyword search tool below to find specific information within the annual report.-
 1
1 -
2
-
3
-
4
-
5
-
6
-
7
-
8
-
9
-
10
-
11
-
12
-
13
-
14
-
15
-
16
-
17
-
18
-
19
-
20
-
21
-
22
-
23
-
24
-
25
-
26
-
27
-
28
-
29
-
30
-
31
-
32
-
33
-
34
-
35
-
36
-
37
-
38
-
39
-
40
-
41
-
42
-
43
-
44
-
45
-
46
-
47
-
48
-
49
-
50
-
51
-
 52
52 -
 53
53 -
 54
54 -
 55
55 -
 56
56 -
 57
57 -
 58
58 -
 59
59 -
 60
60 -
 61
61 -
 62
62 -
 63
63 -
 64
64 -
 65
65 -
 66
66 -
 67
67 -
 68
68 -
 69
69 -
 70
70 -
 71
71 -
 72
72 -
73
-
74
-
75
-
76
-
77
-
78
-
79
-
80
-
81
-
82
-
83
-
84
-
85
-
86
-
87
-
88
-
89
-
90
-
91
-
92
-
93
-
94
-
95
-
96
-
97
-
98
-
99
-
100
-
101
-
102
-
103
-
104
-
105
-
106
-
107
-
108
 |
 |

60
PART II
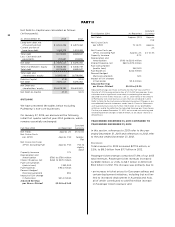
The fixed charge coverage ratio is calculated by divid-
ing net cash from operations for the past four quarters
by the sum of dividend payments plus scheduled prin-
cipal debt payments in excess of any new financings
for the past four quarters. Our minimum net worth
and maximum net debt-to-capital calculations exclude
the impact of Accumulated other comprehensive
income (loss) on Total shareholders’ equity. We are
well in excess of all financial covenant requirements
as of December 31, 2013. The specific covenants and
related definitions can be found in the applicable debt
agreements, the majority of which have been previously
filed with the Securities and Exchange Commission.
DIVIDENDS
In December 2013, we declared a cash dividend on
our common stock of $0.25 per share which was paid
in the first quarter of 2014. We declared a cash divi-
dend on our common stock of $0.25 per share during
the third quarter of 2013 which was paid in the fourth
quarter of 2013. We declared and paid a cash dividend
on our common stock of $0.12 per share during the
first and second quarters of 2013.
ITEM 7A. QUANTITATIVE AND QUALITATIVE
DISCLOSURES ABOUT MARKET RISK
FINANCIAL INSTRUMENTS AND OTHER
General
We are exposed to market risk attributable to changes
in interest rates, foreign currency exchange rates and
fuel prices. We manage these risks through a combina-
tion of our normal operating and financing activities
and through the use of derivative financial instruments
pursuant to our hedging practices and policies. The
financial impact of these hedging instruments is pri-
marily offset by corresponding changes in the under-
lying exposures being hedged. We achieve this by
closely matching the amount, term and conditions of
the derivative instrument with the underlying risk being
hedged. Although certain of our derivative financial
instruments do not qualify or are not accounted for
under hedge accounting, we do not hold or issue
derivative financial instruments for trading or other
speculative purposes. We monitor our derivative posi-
tions using techniques including market valuations
and sensitivity analyses. (See Note 14. Fair Value
Measurements and Derivative Instruments to our con-
solidated financial statements under Item 8. Financial
Statements and Supplementary Data.)
Interest Rate Risk
Our exposure to market risk for changes in interest
rates relates to our long-term debt obligations includ-
ing future interest payments, and our operating
lease for Brilliance of the Seas. At December 31,
2013, approximately 34.6% of our long-term debt
was effectively fixed as compared to 45.8% as of
December 31, 2012. We use interest rate swap agree-
ments to modify our exposure to interest rate move-
ments and to manage our interest expense and
rent expense.
Market risk associated with our long-term fixed-rate
debt is the potential increase in fair value resulting
from a decrease in interest rates. We use interest rate
swap agreements that effectively convert a portion
of our fixed-rate debt to a floating-rate basis to man-
age this risk. At December 31, 2013 and December 31,
2012, we maintained interest rate swap agreements
on the $420.0 million fixed-rate portion of our Oasis
of the Seas unsecured amortizing term loan. The
interest rate swap agreements effectively changed
the interest rate on the balance of the unsecured term
loan, which was $280.0 million as of December 31,
2013, from a fixed rate of 5.41% to a LIBOR-based
floating rate equal to LIBOR plus 3.87%, currently
approximately 4.23%. In addition, during 2013, we
entered into interest rate swap agreements that effec-
tively changed the interest rate on the $650.0 million
unsecured senior notes due 2022, from a fixed rate of
5.25% to a LIBOR-based floating rate equal to LIBOR
plus 3.63%, currently approximately 3.87%. These
interest rate swap agreements are accounted for as
fair value hedges.
The estimated fair value of our long-term fixed-rate
debt at December 31, 2013 was $3.3 billion, using
quoted market prices, where available, or using the
present value of expected future cash flows which
incorporates risk profile. The fair value of our fixed to
floating interest rate swap agreements was estimated
to be a liability of $69.6 million as of December 31,
2013, based on the present value of expected future
cash flows. A hypothetical one percentage point
decrease in interest rates at December 31, 2013 would
increase the fair value of our hedged and unhedged
long-term fixed-rate debt by approximately $109.9
million and would increase the fair value of our
fixed to floating interest rate swap agreements by
$60.8 million.