Royal Caribbean Cruise Lines 2013 Annual Report Download - page 18
Download and view the complete annual report
Please find page 18 of the 2013 Royal Caribbean Cruise Lines annual report below. You can navigate through the pages in the report by either clicking on the pages listed below, or by using the keyword search tool below to find specific information within the annual report.-
 1
1 -
2
-
3
-
4
-
5
-
6
-
7
-
 8
8 -
 9
9 -
 10
10 -
 11
11 -
 12
12 -
 13
13 -
 14
14 -
 15
15 -
 16
16 -
 17
17 -
 18
18 -
 19
19 -
 20
20 -
 21
21 -
 22
22 -
 23
23 -
 24
24 -
 25
25 -
 26
26 -
 27
27 -
 28
28 -
29
-
30
-
31
-
32
-
33
-
34
-
35
-
36
-
37
-
38
-
39
-
40
-
41
-
42
-
43
-
44
-
45
-
46
-
47
-
48
-
49
-
50
-
51
-
52
-
53
-
54
-
55
-
56
-
57
-
58
-
59
-
60
-
61
-
62
-
63
-
64
-
65
-
66
-
67
-
68
-
69
-
70
-
71
-
72
-
73
-
74
-
75
-
76
-
77
-
78
-
79
-
80
-
81
-
82
-
83
-
84
-
85
-
86
-
87
-
88
-
89
-
90
-
91
-
92
-
93
-
94
-
95
-
96
-
97
-
98
-
99
-
100
-
101
-
102
-
103
-
104
-
105
-
106
-
107
-
108
 |
 |

16
PART I
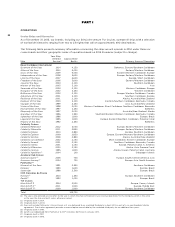
The following table details the growth in global weighted average berths and the global, North American and
European cruise guests over the past five years:
Year
Weighted-Average
SupplyofBerths
MarketedGlobally()
RoyalCaribbean
CruisesLtd
TotalBerths
Global
CruiseGuests()
NorthAmerican
CruiseGuests()
European
CruiseGuests()
() Source: Our estimates of the number of global cruise guests and the weighted-average supply of berths marketed globally are based on a com-
bination of data that we obtain from various publicly available cruise industry trade information sources including Seatrade Insider, Cruise Industry
News and Cruise Line International Association (“CLIA”). In addition, our estimates incorporate our own statistical analysis utilizing the same
publicly available cruise industry data as a base.
() Source: Cruise Line International Association based on cruise guests carried for at least two consecutive nights for years 2009 through 2012.
Year 2013 amounts represent our estimates (see number 1 above). Includes the United States of America and Canada.
() Source: CLIA Europe, formerly European Cruise Council, for years 2009 through 2012. Year 2013 amounts represent our estimates (see number
1 above).
North America
The majority of cruise guests are sourced from North
America, which represented approximately 56% of
global cruise guests in 2013. The compound annual
growth rate in cruise guests sourced from this market
was approximately 3.2% from 2009 to 2013.
Europe
Cruise guests sourced from Europe represented
approximately 30% of global cruise guests in 2013.
The compound annual growth rate in cruise guests
sourced from this market was approximately 6.0%
from 2009 to 2013.
Other Markets
In addition to expected industry growth in North
America and Europe, we expect the Asia/Pacific
region to demonstrate an even higher growth rate in
the near term, although it will continue to represent
a relatively small sector compared to North America
and Europe. Based on industry data, cruise guests
sourced from the Asia/Pacific region represented
approximately 4.5% of global cruise guests in 2013.
The compound annual growth rate in cruise guests
sourced from this market was approximately 15%
from 2011 to 2013.
COMPETITION
We compete with a number of cruise lines. Our princi-
pal competitors are Carnival Corporation & plc, which
owns, among others, Aida Cruises, Carnival Cruise
Lines, Costa Cruises, Cunard Line, Holland America
Line, Iberocruceros, P&O Cruises and Princess Cruises;
Disney Cruise Line; MSC Cruises; Norwegian Cruise
Line and Oceania Cruises. Cruise lines compete with
other vacation alternatives such as land-based resort
hotels and sightseeing destinations for consumers’
leisure time. Demand for such activities is influenced
by political and general economic conditions. Com-
panies within the vacation market are dependent on
consumer discretionary spending.
OPERATING STRATEGIES
Our principal operating strategies are to:
đƫƫ,.+0!0ƫ0$!ƫ$!(0$Čƫ/"!05ƫ* ƫ/!1.%05ƫ+"ƫ+1.ƫ#1!/0/ƫ
and employees and protect the environment in
which our vessels and organization operate,
đƫƫ/0.!*#0$!*ƫ* ƫ/1,,+.0ƫ+1.ƫ$1)*ƫ,%0(ƫ%*ƫ+. !.ƫ
to better serve our global guest base and grow
our business,
đƫƫ"1.0$!.ƫ/0.!*#0$!*ƫ+1.ƫ+*/1)!.ƫ!*##!)!*0ƫ%*ƫ
order to enhance our revenues,
đƫƫ%*.!/!ƫ0$!ƫ3.!*!//ƫ* ƫ).'!0ƫ,!*!0.0%+*ƫ+"ƫ
our brands globally,
đƫƫ"+1/ƫ+*ƫ+/0ƫ!""%%!*5Čƫ)*#!ƫ+1.ƫ+,!.0%*#ƫ
expenditures and ensure adequate cash and liquid-
ity, with the overall goal of maximizing our return on
invested capital and long-term shareholder value,
đƫƫ/0.0!#%((5ƫ%*2!/0ƫ%*ƫ+1.ƫ"(!!0ƫ0$.+1#$ƫ0$!ƫ.!2%0(-
ization and maintenance of existing ships and the
transfer of key innovations across each brand, while
prudently expanding our fleet with new state-of-
the-art cruise ships,
đƫƫ,%0(%6!ƫ+*ƫ0$!ƫ,+.0%(%05ƫ* ƫ"(!4%%(%05ƫ+"ƫ+1.ƫ
ships by deploying them into those markets and
itineraries that provide opportunities to optimize
returns, while continuing our focus on existing
key markets,
đƫƫ"1.0$!.ƫ!*$*!ƫ+1.ƫ0!$*+(+#%(ƫ,%(%0%!/ƫ0+ƫ
service customer preferences and expectations in
an innovative manner, while supporting our strategic
focus on profitability, and