Royal Caribbean Cruise Lines 2013 Annual Report Download - page 54
Download and view the complete annual report
Please find page 54 of the 2013 Royal Caribbean Cruise Lines annual report below. You can navigate through the pages in the report by either clicking on the pages listed below, or by using the keyword search tool below to find specific information within the annual report.-
 1
1 -
2
-
3
-
4
-
5
-
6
-
7
-
8
-
9
-
10
-
11
-
12
-
13
-
14
-
15
-
16
-
17
-
18
-
19
-
20
-
21
-
22
-
23
-
24
-
25
-
26
-
27
-
28
-
29
-
30
-
31
-
32
-
33
-
34
-
35
-
36
-
37
-
38
-
39
-
40
-
41
-
42
-
43
-
 44
44 -
 45
45 -
 46
46 -
 47
47 -
 48
48 -
 49
49 -
 50
50 -
 51
51 -
 52
52 -
 53
53 -
 54
54 -
 55
55 -
 56
56 -
 57
57 -
 58
58 -
 59
59 -
 60
60 -
 61
61 -
 62
62 -
 63
63 -
 64
64 -
65
-
66
-
67
-
68
-
69
-
70
-
71
-
72
-
73
-
74
-
75
-
76
-
77
-
78
-
79
-
80
-
81
-
82
-
83
-
84
-
85
-
86
-
87
-
88
-
89
-
90
-
91
-
92
-
93
-
94
-
95
-
96
-
97
-
98
-
99
-
100
-
101
-
102
-
103
-
104
-
105
-
106
-
107
-
108
 |
 |

52
PART II
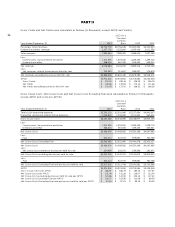
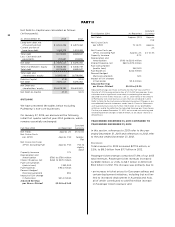
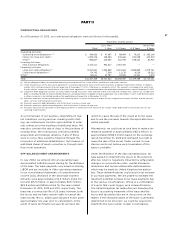
Net Debt-to-Capital was calculated as follows
(in thousands):
As of December 31,
Long-term debt, net
of current portion
Current portion of
long-term debt
Total debt
Less: Cash and cash
equivalents
Net Debt
Total shareholders’ equity
Total debt
Total debt and
shareholders’ equity
Debt-to-Capital
Net Debt
Net Debt and
shareholders’ equity
Net Debt-to-Capital
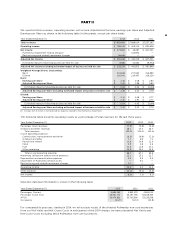
OUTLOOK
We have presented the tables below excluding
Pullmantur’s non-core businesses.
On January 27, 2014, we announced the following
initial first quarter and full year 2014 guidance, which
remains essentially unchanged:
Full Year 2014 As Reported
Constant
Currency
Net Yields Approx. 2% 2% to 3%
Net Cruise Costs
per APCD Approx. Flat Approx.
Flat
Net Cruise Costs per
APCD, excluding Fuel Approx. Flat Flat to
slightly
down
Capacity Increase 1.7%
Depreciation and
Amortization $780 to $790 million
Interest Expense, net $260 to $270 million
Fuel Consumption
(metric tons) 1,352,000
Fuel Expenses $944 million
Percent Hedged
(fwd consumption) 55%
Impact of 10% change
in fuel prices $41.4 million
Adjusted Earnings
per Share—Diluted* $3.20 to $3.40
First Quarter 2014 As Reported
Constant
Currency
Net Yields Approx. (2%) Approx.
Flat
Net Cruise Costs
per APCD 1% to 2% Approx.
2%
Net Cruise Costs per
APCD, excluding Fuel Approx. 2% 2% to 3%
Capacity Increase 0.7%
Depreciation and
Amortization $190 to $200 million
Interest Expense, net $60 to $70 million
Fuel Consumption
(metric tons) 342,000
Fuel Expenses $242 million
Percent Hedged
(fwd consumption) 52%
Impact of 10% change
in fuel prices $11.5 million
Adjusted Earnings
per Share—Diluted* $0.20 to $0.30
* Adjusted Earnings per Share estimates for the Full Year and First
Quarter of 2014 are presented in lieu of US GAAP earnings per share
estimates due to significant uncertainty in projecting the amounts
adjusted to arrive at this measure, such as, uncertainty in the amount
of Pullmantur non-core business results that we will absorb in 2014.
Refer to Note 16. Restructuring and Related Impairment Charges in our
consolidated financial statements under Item 8. Financial Statements
and Supplementary Data for further information on our profitability
initiatives and to the definition for Adjusted Earnings per Share herein.
For the year ended December 31, 2013, we incurred restructuring and
related impairment charges of $56.9 million, or $0.26 per share on a
diluted basis.
YEAR ENDED DECEMBER 31, 2013 COMPARED TO
YEAR ENDED DECEMBER 31, 2012
In this section, references to 2013 refer to the year
ended December 31, 2013 and references to 2012 refer
to the year ended December 31, 2012.
Revenues
Total revenues for 2013 increased $271.9 million, or
3.5%, to $8.0 billion from $7.7 billion in 2012.
Passenger ticket revenues comprised 71.9% of our 2013
total revenues. Passenger ticket revenues increased
by $128.1 million, or 2.3%, to $5.7 billion in 2013 from
$5.6 billion in 2012. The increase was primarily due to:
đƫƫ*ƫ%*.!/!ƫ%*ƫ0%'!0ƫ,.%!/ƫ"+.ƫ1.+,!*ƫ/%(%*#/ƫ* ƫ
certain deployment initiatives, including but not lim-
ited to increased deployment in Australia and Asia,
all of which contributed to a $117.6 million increase
in Passenger ticket revenues; and