Royal Caribbean Cruise Lines 2013 Annual Report Download - page 40
Download and view the complete annual report
Please find page 40 of the 2013 Royal Caribbean Cruise Lines annual report below. You can navigate through the pages in the report by either clicking on the pages listed below, or by using the keyword search tool below to find specific information within the annual report.-
 1
1 -
2
-
3
-
4
-
5
-
6
-
7
-
8
-
9
-
10
-
11
-
12
-
13
-
14
-
15
-
16
-
17
-
18
-
19
-
20
-
21
-
22
-
23
-
24
-
25
-
26
-
27
-
28
-
29
-
 30
30 -
 31
31 -
 32
32 -
 33
33 -
 34
34 -
 35
35 -
 36
36 -
 37
37 -
 38
38 -
 39
39 -
 40
40 -
 41
41 -
 42
42 -
 43
43 -
 44
44 -
 45
45 -
 46
46 -
 47
47 -
 48
48 -
 49
49 -
 50
50 -
51
-
52
-
53
-
54
-
55
-
56
-
57
-
58
-
59
-
60
-
61
-
62
-
63
-
64
-
65
-
66
-
67
-
68
-
69
-
70
-
71
-
72
-
73
-
74
-
75
-
76
-
77
-
78
-
79
-
80
-
81
-
82
-
83
-
84
-
85
-
86
-
87
-
88
-
89
-
90
-
91
-
92
-
93
-
94
-
95
-
96
-
97
-
98
-
99
-
100
-
101
-
102
-
103
-
104
-
105
-
106
-
107
-
108
 |
 |
38
PART II
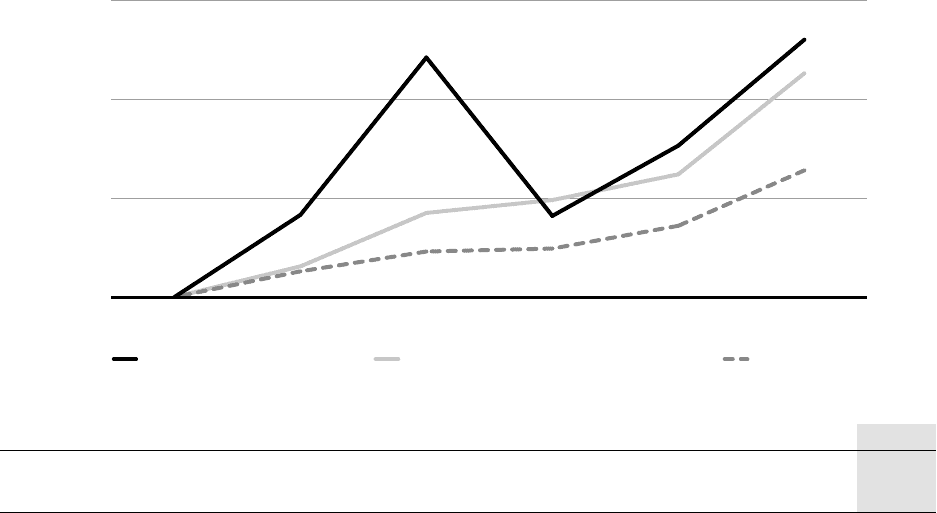
PERFORMANCE GRAPH
The following graph compares the total return, assuming reinvestment of dividends, on an investment in the
Company, based on performance of the Company’s common stock, with the total return of the Standard & Poor’s
500 Composite Stock Index and the Dow Jones United States Travel and Leisure Index for a five year period by
measuring the changes in common stock prices from December 31, 2008 to December 31, 2013.
Royal Caribbean Cruises Ltd.
S&P 500
Dow Jones US Travel & Leisure
The stock performance graph assumes for comparison that the value of the Company’s common stock and of each
index was $100 on December 31, 2008 and that all dividends were reinvested. Past performance is not necessarily
an indicator of future results.
100
200
300
$400
12/1312/1212/1112/0912/08 12/10
Royal Caribbean Cruises Ltd. Dow Jones US Travel & Leisure Supersector S&P 500