Royal Caribbean Cruise Lines 2013 Annual Report Download - page 56
Download and view the complete annual report
Please find page 56 of the 2013 Royal Caribbean Cruise Lines annual report below. You can navigate through the pages in the report by either clicking on the pages listed below, or by using the keyword search tool below to find specific information within the annual report.-
 1
1 -
2
-
3
-
4
-
5
-
6
-
7
-
8
-
9
-
10
-
11
-
12
-
13
-
14
-
15
-
16
-
17
-
18
-
19
-
20
-
21
-
22
-
23
-
24
-
25
-
26
-
27
-
28
-
29
-
30
-
31
-
32
-
33
-
34
-
35
-
36
-
37
-
38
-
39
-
40
-
41
-
42
-
43
-
44
-
45
-
 46
46 -
 47
47 -
 48
48 -
 49
49 -
 50
50 -
 51
51 -
 52
52 -
 53
53 -
 54
54 -
 55
55 -
 56
56 -
 57
57 -
 58
58 -
 59
59 -
 60
60 -
 61
61 -
 62
62 -
 63
63 -
 64
64 -
 65
65 -
 66
66 -
67
-
68
-
69
-
70
-
71
-
72
-
73
-
74
-
75
-
76
-
77
-
78
-
79
-
80
-
81
-
82
-
83
-
84
-
85
-
86
-
87
-
88
-
89
-
90
-
91
-
92
-
93
-
94
-
95
-
96
-
97
-
98
-
99
-
100
-
101
-
102
-
103
-
104
-
105
-
106
-
107
-
108
 |
 |

54
PART II
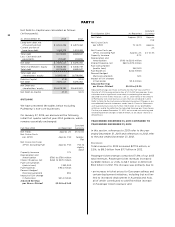
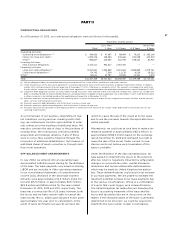
Other expense decreased $41.1 million, or 96.0%, to
$1.7 million in 2013 compared to $42.9 million for
the same period in 2012. This change was primarily
due to:
đƫƫƫĸĂĊċĉƫ !.!/!ƫ%*ƫ !"!..! ƫ%*+)!ƫ04ƫ!4,!*/!ƫ/ƫ
a result of a 100% valuation allowance recorded in
connection with Pullmantur’s deferred tax assets in
2012 partially offset by a reduction in Pullmantur’s
deferred tax liability and resulting tax benefit related
to a 2013 impairment of Pullmantur’s long-lived
assets and a 2012 impairment charge of Pullmantur’s
trademarks and trade names; and
đƫƫ%*+)!ƫ+"ƫĸăĂċĀƫ)%((%+*ƫ".+)ƫ+1.ƫ!-1%05ƫ)!0$+ ƫ
investments in 2013 as compared to income of $23.8
million in 2012.
Net Yields
Net Yields increased 2.7% in 2013 compared to 2012
primarily due to an increase in ticket prices, onboard
revenue and Pullmantur’s travel agency network
and air charter business noted above. Net Yields
increased 3.2% in 2013 compared to 2012 on a
Constant Currency basis.
Net Cruise Costs
Net Cruise Costs increased 2.7% in 2013 compared to
2012 primarily due to the increase in crew expenses,
food expenses, indirect operating expenses and
expenses related to Pullmantur’s travel agency network
and air charter business, noted above. Net Cruise Costs
per APCD increased 1.9% in 2013 compared to 2012.
Net Cruise Costs per APCD on a Constant Currency
basis increased 1.7% in 2013 compared to 2012.
Net Cruise Costs Excluding Fuel
Net Cruise Costs Excluding Fuel per APCD increased
2.1% in 2013 compared to 2012. Net Cruise Costs
Excluding Fuel per APCD on a Constant Currency
basis increased 1.8% in 2013 compared to 2012.
YEAR ENDED DECEMBER 31, 2012 COMPARED TO
YEAR ENDED DECEMBER 31, 2011
In this section, references to 2012 refer to the year
ended December 31, 2012 and references to 2011 refer
to the year ended December 31, 2011.
Revenues
Total revenues for 2012 increased $150.8 million, or
2.0%, to $7.7 billion from $7.5 billion in 2011.
Passenger ticket revenues comprised 72.8% of our 2012
total revenues. Passenger ticket revenues increased
by $68.7 million, or 1.2%, to $5.6 billion in 2012 from
$5.5 billion in 2011. The increase was primarily due to:
đƫƫ*ƫ%*.!/!ƫ%*ƫ0%'!0ƫ,.%!/ƫ,.%).%(5ƫ .%2!*ƫ5ƫ
changes to our international distribution system
mainly in Brazil and certain deployment initiatives
including, but not limited to increased deployment
in Australia and China, all of which contributed to
a $94.6 million increase in Passenger ticket reve-
nues; and
đƫƫƫāċąŌƫ%*.!/!ƫ%*ƫ,%05Čƫ3$%$ƫ+*0.%10! ƫ0+ƫƫ
$78.1 million increase in passenger ticket revenue.
The increase in capacity was primarily due to the
addition of Celebrity Silhouette which entered service
in July 2011 and the addition of Celebrity Reflection
which entered service in October 2012. This increase
was partially offset by the sale of Celebrity Mercury
to TUI Cruises in February 2011 and the completion
of our one-year charter of Bleu de France in Novem-
ber 2011 following its sale to a third party in November
2010. The increase in capacity was also partially off-
set by the delivery of Ocean Dream to an unrelated
third party in April 2012 as part of a six-year bareboat
charter agreement.
The increase was partially offset by the unfavorable
effect of changes in foreign currency exchange rates
related to our passenger ticket revenue transactions
denominated in currencies other than the United States
dollar of approximately $104.0 million.
The remaining 27.2% of 2012 total revenues was com-
prised of Onboard and other revenues, which increased
$82.1 million, or 4.1%, to $2.1 billion in 2012 from $2.0
billion in 2011. The increase was primarily due to:
đƫƫƫĸăĂċĆƫ)%((%+*ƫ%*.!/!ƫ%*ƫ+*+. ƫ.!2!*1!ƫ00.%10-
able to higher spending on a per passenger basis
primarily due to the addition of specialty restaurants
and other onboard activities as a result of our ship
revitalization projects and other revenue enhancing
initiatives. Onboard and other revenues included
concession revenues of $288.6 million in 2012 and
$273.4 million in 2011;
đƫƫƫĸĂĆċąƫ)%((%+*ƫ%*.!/!ƫ00.%10(!ƫ0+ƫ0$!ƫāċąŌƫ
increase in capacity noted above; and
đƫƫƫĸāĊċāƫ)%((%+*ƫ%*.!/!ƫ%*ƫ.!2!*1!/ƫ.!(0! ƫ0+ƫ
Pullmantur’s travel agency network and air charter
business due to an increase in guests and the addi-
tion of new itineraries.