Royal Caribbean Cruise Lines 2013 Annual Report Download - page 58
Download and view the complete annual report
Please find page 58 of the 2013 Royal Caribbean Cruise Lines annual report below. You can navigate through the pages in the report by either clicking on the pages listed below, or by using the keyword search tool below to find specific information within the annual report.-
 1
1 -
2
-
3
-
4
-
5
-
6
-
7
-
8
-
9
-
10
-
11
-
12
-
13
-
14
-
15
-
16
-
17
-
18
-
19
-
20
-
21
-
22
-
23
-
24
-
25
-
26
-
27
-
28
-
29
-
30
-
31
-
32
-
33
-
34
-
35
-
36
-
37
-
38
-
39
-
40
-
41
-
42
-
43
-
44
-
45
-
46
-
47
-
 48
48 -
 49
49 -
 50
50 -
 51
51 -
 52
52 -
 53
53 -
 54
54 -
 55
55 -
 56
56 -
 57
57 -
 58
58 -
 59
59 -
 60
60 -
 61
61 -
 62
62 -
 63
63 -
 64
64 -
 65
65 -
 66
66 -
 67
67 -
 68
68 -
69
-
70
-
71
-
72
-
73
-
74
-
75
-
76
-
77
-
78
-
79
-
80
-
81
-
82
-
83
-
84
-
85
-
86
-
87
-
88
-
89
-
90
-
91
-
92
-
93
-
94
-
95
-
96
-
97
-
98
-
99
-
100
-
101
-
102
-
103
-
104
-
105
-
106
-
107
-
108
 |
 |

56
PART II
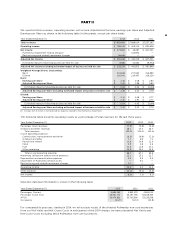
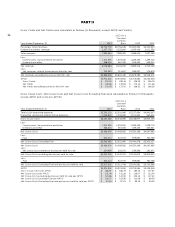
Net Yields
Net Yields increased 1.5% in 2012 compared to 2011
primarily due an increase in Pullmantur’s land based
tours, hotel and air packages revenue and an increase
in onboard spending. In addition, the increase was
due to the changes in our international distribution
system mainly in Brazil and certain deployment initia-
tives. Net Yields increased 3.0% in 2012 compared to
2011 on a Constant Currency basis.
Net Cruise Costs
Net Cruise Costs increased 6.9% in 2012 compared to
2011 due to the 1.4% increase in capacity and a 5.4%
increase in Net Cruise Cost per APCD. The increase
in Net Cruise Costs per APCD was primarily due to
an increase in fuel and Pullmantur’s land-based tours,
hotel and air packages expenses as discussed above.
In addition, the increase in Net Cruise Cost per APCD
was due to the changes in our international distribu-
tion system mainly in Brazil and certain deployment
initiatives.
Net Cruise Costs per APCD increased 6.8% in 2012
compared to 2011 on a Constant Currency basis. Net
Cruise Costs Excluding Fuel per APCD increased 2.7%
in 2012 compared to 2011. Net Cruise Costs Excluding
Fuel per APCD increased 4.2% in 2012 compared to
2011 on a Constant Currency basis.
FUTURE APPLICATION OF ACCOUNTING STANDARDS
Refer to Note 2. Summary of Significant Accounting
Policies to our consolidated financial statements under
Item 8. Financial Statements and Supplementary
Data for further information on Recent Accounting
Pronouncements.
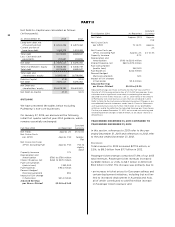
LIQUIDITY AND CAPITAL RESOURCES
Sources and Uses of Cash
Cash flow generated from operations provides us with
a significant source of liquidity. Net cash provided by
operating activities remained consistent at $1.4 billion.
The primary drivers for 2013 include a $392.5 million
increase in cash receipts from customer deposits and
an $88.0 million increase in cash receipts from onboard
spending, mostly offset by $69.7 million of cash
received on the settlement of derivative financial
instruments in 2012 which did not recur in 2013 and
the timing of payments to vendors in 2013 as com-
pared to 2012.
Net cash used in investing activities was $824.5 million
for 2013 compared to $1.3 billion for 2012. During 2013,
our use of cash was primarily related to capital expen-
ditures of $763.8 million, down from $1.3 billion for
2012. The decrease in capital expenditures is attribut-
able to the delivery of a ship, Celebrity Reflection, in
2012 which did not recur in 2013, partially offset by a
higher level of ships under construction in 2013 com-
pared to 2012. The decrease in capital expenditures
was partially offset by investments of $70.6 million to
our unconsolidated affiliates during 2013. In addition,
during 2013 we paid $17.3 million on settlements on
our foreign currency forward contracts, up from $10.9
million paid in 2012.
Net cash used in financing activities was $576.6 mil-
lion for 2013 compared to $179.6 million for 2012. This
change was primarily due to an increase of $295.2
million in repayments of debt, a decrease of $109.0
million in debt proceeds and an increase of $25.9 mil-
lion paid in dividends. The increase in repayments
of debt was primarily due to the payment at maturity
of $900.0 million of unsecured senior notes, partially
offset by a decrease of $170.0 million in repayments
on unsecured revolving credit facilities, a decrease
in the early extinguishment of senior notes of $319.7
million and the prepayment of a $100.0 million unse-
cured term loan during 2012. The decrease in debt
proceeds was primarily due to a $650.0 million bond
issuance and $963.5 million of debt facilities being
drawn upon in 2012, partially offset by $474.5 million
drawn upon in 2013 and an increase of $1.0 billion of
borrowings on our revolving credit facilities in 2013.
FUTURE CAPITAL COMMITMENTS
Our future capital commitments consist primarily
of new ship orders. As of December 31, 2013, we
had three Quantum-class ships and one Oasis-class
ship on order for our Royal Caribbean International
brand with an aggregate capacity of approximately
17,850 berths.
As of December 31, 2013, the aggregate cost of our
ships on order was approximately $4.7 billion, of
which we had disbursed $518.8 million as of such
date. Approximately 36.3% of the aggregate cost was
exposed to fluctuations in the Euro exchange rate at
December 31, 2013. (See Note 14. Fair Value Measure-
ments and Derivative Instruments and Note 15. Com-
mitments and Contingencies to our consolidated
financial statements under Item 8. Financial Statements
and Supplementary Data).
As of December 31, 2013, anticipated overall capital
expenditures, based on our existing ships on order,
are approximately $1.3 billion for 2014, $1.3 billion for
2015, $2.1 billion for 2016 and $0.3 billion for 2017.