Royal Caribbean Cruise Lines 2013 Annual Report Download - page 48
Download and view the complete annual report
Please find page 48 of the 2013 Royal Caribbean Cruise Lines annual report below. You can navigate through the pages in the report by either clicking on the pages listed below, or by using the keyword search tool below to find specific information within the annual report.-
 1
1 -
2
-
3
-
4
-
5
-
6
-
7
-
8
-
9
-
10
-
11
-
12
-
13
-
14
-
15
-
16
-
17
-
18
-
19
-
20
-
21
-
22
-
23
-
24
-
25
-
26
-
27
-
28
-
29
-
30
-
31
-
32
-
33
-
34
-
35
-
36
-
37
-
 38
38 -
 39
39 -
 40
40 -
 41
41 -
 42
42 -
 43
43 -
 44
44 -
 45
45 -
 46
46 -
 47
47 -
 48
48 -
 49
49 -
 50
50 -
 51
51 -
 52
52 -
 53
53 -
 54
54 -
 55
55 -
 56
56 -
 57
57 -
 58
58 -
59
-
60
-
61
-
62
-
63
-
64
-
65
-
66
-
67
-
68
-
69
-
70
-
71
-
72
-
73
-
74
-
75
-
76
-
77
-
78
-
79
-
80
-
81
-
82
-
83
-
84
-
85
-
86
-
87
-
88
-
89
-
90
-
91
-
92
-
93
-
94
-
95
-
96
-
97
-
98
-
99
-
100
-
101
-
102
-
103
-
104
-
105
-
106
-
107
-
108
 |
 |

46
PART II
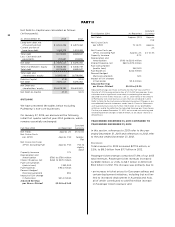
Gross Yields represent total revenues per APCD.
Net Cruise Costs and Net Cruise Costs Excluding Fuel
represent Gross Cruise Costs excluding commissions,
transportation and other expenses and onboard
and other expenses and, in the case of Net Cruise
Costs Excluding Fuel, fuel expenses (each of which
is described above under the Description of Certain
Line Items heading). In measuring our ability to control
costs in a manner that positively impacts net income,
we believe changes in Net Cruise Costs and Net Cruise
Costs Excluding Fuel to be the most relevant indica-
tors of our performance. A reconciliation of historical
Gross Cruise Costs to Net Cruise Costs and Net Cruise
Costs Excluding Fuel is provided below under Results
of Operations. We have not provided a quantitative
reconciliation of projected Gross Cruise Costs to pro-
jected Net Cruise Costs and projected Net Cruise
Costs Excluding Fuel due to the significant uncer-
tainty in projecting the costs deducted to arrive at
these measures. Accordingly, we do not believe that
reconciling information for such projected figures
would be meaningful. For comparability purposes,
starting in 2014, we will exclude results of the divested
Pullmantur non-core businesses from our Net Cruise
Costs. In anticipation of the 2014 change, we have
presented Net Cruise Costs excluding these Pullmantur
non-core businesses in the financial tables under
Results of Operations.
Net Debt-to-Capital is a ratio which represents total
long-term debt, including current portion of long-term
debt, less cash and cash equivalents (“Net Debt”)
divided by the sum of Net Debt and total shareholders’
equity. We believe Net Debt and Net Debt-to-Capital,
along with total long-term debt and shareholders’
equity are useful measures of our capital structure.
A reconciliation of historical Debt-to-Capital to Net
Debt-to-Capital is provided below under Results
of Operations.
Net Revenues represent total revenues less commis-
sions, transportation and other expenses and onboard
and other expenses (each of which is described above
under the Description of Certain Line Items heading).
For comparability purposes, starting in 2014, we will
exclude results of the divested Pullmantur non-core
businesses from our Net Revenues. In anticipation of
the 2014 change, we have presented Net Revenues
excluding these Pullmantur non-core businesses in
the financial tables under Results of Operations.
The estimated impact of the divested Pullmantur non-
core businesses was arrived at by adjusting net loss
of these businesses for the ownership percentage
we will retain as well as intercompany transactions
that will no longer be eliminated in our consolidated
statements of comprehensive income (loss).
Net Yields represent Net Revenues per APCD. We
utilize Net Revenues and Net Yields to manage our
business on a day-to-day basis as we believe that it is
the most relevant measure of our pricing performance
because it reflects the cruise revenues earned by us
net of our most significant variable costs, which are
commissions, transportation and other expenses and
onboard and other expenses. A reconciliation of his-
torical Gross Yields to Net Yields is provided below
under Results of Operations. We have not provided a
quantitative reconciliation of projected Gross Yields
to projected Net Yields due to the significant uncer-
tainty in projecting the costs deducted to arrive at
this measure. Accordingly, we do not believe that rec-
onciling information for such projected figures would
be meaningful. For comparability purposes, starting in
2014, we will exclude results of the divested Pullmantur
non-core businesses from our Net Yields. In anticipa-
tion of the 2014 change, we have presented Net Yields
excluding these Pullmantur non-core businesses in the
financial tables under Results of Operations.
Occupancy, in accordance with cruise vacation
industry practice, is calculated by dividing Passenger
Cruise Days by APCD. A percentage in excess of 100%
indicates that three or more passengers occupied
some cabins.
Passenger Cruise Days represent the number of
passengers carried for the period multiplied by the
number of days of their respective cruises.
We believe Net Yields, Net Cruise Costs and Net Cruise
Costs Excluding Fuel are our most relevant non-GAAP
financial measures. However, a significant portion of
our revenue and expenses are denominated in curren-
cies other than the United States dollar. Because our
reporting currency is the United States dollar, the
value of these revenues and expenses can be affected
by changes in currency exchange rates. Although
such changes in local currency prices is just one of
many elements impacting our revenues and expenses,
it can be an important element. For this reason, we
also monitor Net Yields, Net Cruise Costs and Net
Cruise Costs Excluding Fuel as if the current period’s
currency exchange rates had remained constant with
the comparable prior period’s rates, or on a “Constant
Currency” basis.