Royal Caribbean Cruise Lines 2007 Annual Report Download - page 42
Download and view the complete annual report
Please find page 42 of the 2007 Royal Caribbean Cruise Lines annual report below. You can navigate through the pages in the report by either clicking on the pages listed below, or by using the keyword search tool below to find specific information within the annual report.-
 1
1 -
2
-
3
-
4
-
5
-
6
-
7
-
8
-
9
-
10
-
11
-
12
-
13
-
14
-
15
-
16
-
17
-
18
-
19
-
20
-
21
-
22
-
23
-
24
-
25
-
26
-
27
-
28
-
29
-
30
-
31
-
 32
32 -
 33
33 -
 34
34 -
 35
35 -
 36
36 -
 37
37 -
 38
38 -
 39
39 -
 40
40 -
 41
41 -
 42
42 -
 43
43 -
 44
44 -
 45
45 -
 46
46
 |
 |

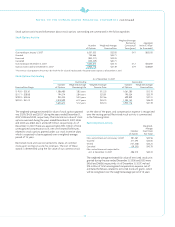
At December 31, 2007, we have future commitments to pay for
our usage of certain port facilities, marine consumables, services
and maintenance contracts as follows (in thousands):
Year
2008 $123,722
2009 74,511
2010 65,089
2011 66,728
2012 70,141
Thereafter 230,249
$630,440
NOTE 15. RELATED PARTIES
A. Wilhelmsen AS. and Cruise Associates collectively own approxi-
mately 35.7% of our common stock and are parties to a shareholders’
agreement which provides that our board of directors will consist
of four nominees of A. Wilhelmsen AS., four nominees of Cruise
Associates and our Chief Executive Officer. They have the power
to determine, among other things, our policies and the policies
of our subsidiaries and actions requiring shareholder approval.
NOTE 16. SUBSEQUENT EVENTS
In February 2008, we entered into a $530.0 million unsecured
term loan due through 2015. We have elected to have the entire
loan amount bear interest at LIBOR plus the then applicable
margin. We intend to use the proceeds of the loan towards the
purchase of Independence of the Seas.
40
NOTES TO THE CONSOLIDATED FINANCIAL STATEMENTS continued
NOTE 17. QUARTERLY SELECTED FINANCIAL DATA (UNAUDITED)
First Quarter Second Quarter Third Quarter Fourth Quarter
(in thousands, except per share data) 2007 2006 2007 2006
2007
2006
2007
2006
Total revenues1
$1,223,126
$1,146,536
$1,481,325
$1,292,984
$1,953,592
$1,636,851
$1,491,095
$1,153,215
Operating income
$ 79,643
$ 141,051
$ 200,883
$ 184,244
$ 482,834
$ 419,609
$ 137,974
$ 113,542
Net income (loss)
$ 8,825
$ 119,499
$ 128,745
$ 122,427
$ 395,000
$ 345,372
$ 70,834
$ 46,624
Earnings (loss) per share:
Basic
$ 0.04
$ 0.57
$ 0.61
$ 0.58
$ 1.85
$ 1.66
$ 0.33
$ 0.22
Diluted
$ 0.04
$ 0.55
$ 0.60
$ 0.57
$ 1.84
$ 1.63
$ 0.33
$ 0.22
Dividends declared per share
$ 0.15
$ 0.15
$ 0.15
$ 0.15
$ 0.15
$ 0.15
$ 0.15
$ 0.15
1Our revenues are seasonal based on the demand for cruises. Demand is strongest for cruises during the North American summer months and holidays.