Royal Caribbean Cruise Lines 2007 Annual Report Download - page 19
Download and view the complete annual report
Please find page 19 of the 2007 Royal Caribbean Cruise Lines annual report below. You can navigate through the pages in the report by either clicking on the pages listed below, or by using the keyword search tool below to find specific information within the annual report.-
 1
1 -
2
-
3
-
4
-
5
-
6
-
7
-
8
-
 9
9 -
 10
10 -
 11
11 -
 12
12 -
 13
13 -
 14
14 -
 15
15 -
 16
16 -
 17
17 -
 18
18 -
 19
19 -
 20
20 -
 21
21 -
 22
22 -
 23
23 -
 24
24 -
 25
25 -
 26
26 -
 27
27 -
 28
28 -
 29
29 -
30
-
31
-
32
-
33
-
34
-
35
-
36
-
37
-
38
-
39
-
40
-
41
-
42
-
43
-
44
-
45
-
46
 |
 |

We expected a 5.1% increase in capacity in 2008, primarily driven
by the addition of Independence of the Seas,which will enter
service in May 2008, a full year of Liberty of the Seas,the addition
of Pacific Star,which will enter service during the first quarter
of 2008 and the addition of Celebrity Solstice,which will enter
service in December 2008.
Depreciation and amortization expenses were expected to be in the
range of $525.0 million to $545.0 million, and interest expense was
expected to be in the range of $340.0 million to $360.0 million.
Based on the expectations contained in this Outlook section, and
assuming that fuel prices remain at the level of the January 30, 2008
“at-the-pump” prices, we expected full year 2008 earnings per
share to be in the range of $3.20 to $3.40.
First Quarter 2008
As announced on January 30, 2008, we expected Net Yields will
increase approximately 7% compared to 2007.
Weexpected Net Cruise Costs per APCD to increase approxi-
mately 1% compared to 2007. Excluding fuel, we expected Net
Cruise Costs per APCD to decrease in the range of 1% to 2%
compared to 2007.
Wedo not forecast fuel prices and our cost outlook for fuel is
based on current “at-the-pump” prices including any hedge
impacts. If fuel prices for the first quarter of 2008 remain at the
level of January 30, 2008, fuel expenses for the first quarter of
2008 would be approximately $145.0 million or $492 per metric
ton. For the first quarter of 2008, our fuel expenseis 52% hedged
and a 10% change in the market price of fuel would result in a
change in fuel costs of approximately $8.0 million for the first
quarter of 2008, after taking intoaccount existing hedges.
Weexpected an 8.8%increase in capacity, primarily driven by the
addition of Liberty of the Seas,which entered service in May 2007.
Depreciation and amortization expenses were expected to be in
the range of $123.0 million to $128.0 million and interest expense
was expected to be in the range of $82.0 million to $87.0 million.
Based on the expectations contained in this Outlook section, and
assuming that fuel prices remain at the level of the January 30, 2008
“at-the-pump” prices, we expected first quarter 2008 earnings per
share to be in the range of $0.30 to $0.35.
Update to Outlook
Since our January 30, 2008 announcement, we have evaluated
major changes in our operating environment including booking
trends, fuel prices, the impact of our fuel supplement and other
factors. Based on our evaluation of these factors, our outlook
for the year remains substantially unchanged and we continue
to expect full year 2008 earnings per share to be in the range
of $3.20 to $3.40. Mainly due to a shift in the timing of certain
expenses, wenowbelievefirst quarter earnings per share will
be in the rangeof $0.25 to $0.30.
YEAR ENDED DECEMBER 31, 2007 COMPARED
TO YEAR ENDED DECEMBER 31, 2006
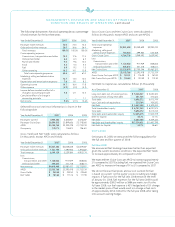
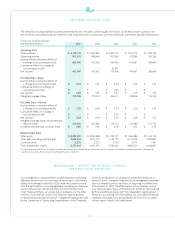
Revenues
Net Revenues increased 16.1% in 2007 compared to 2006 due to
a12.3% increase in capacity and a 3.3% increase in Net Yields. The
increase in capacity was primarily attributed to the addition of
Pullmantur Cruises’ fleet, the addition of Liberty of the Seas,
which entered service in May 2007 and a full year of Freedom of
the Seas.This increase was partially offset by the revitalization
of Majesty of the Seas during the first quarter of 2007 which was
out of service for 28 days and an increase in the number of days
ships were in drydock during 2007 as compared to 2006. The
increase in Net Yields was primarily due to the addition of
Pullmantur’s tour business which provides additional revenues
without corresponding capacity and, to a lesser extent, an
increase in ticket prices on a per passenger basis. This increase
was partially offset by a decrease in onboard revenues primarily
due to an expanded cruise season in certain markets and itinerary
changes for certain ships where guests spend less onboard our
ships. Occupancyin 2007 was 105.7% compared to 106.5% in 2006.
Gross Yields increased 4.7% in 2007 compared to 2006, which
was a larger percentage increase than Net Yields primarily due
to increases in commissions, transportation, other expenses and
onboard and other expenses. The increase in commissions, trans-
portation and other expenses was primarily due to Pullmantur
Cruises’ higher commission expenses. This increase was also due
to increases in these direct costs as a result of an expanded cruise
season in certain markets and itinerary changes for certain ships.
The increasein onboard and other expenses was primarily due to
increases in shoreexcursions and land-tour packages sold toour
guests as a result of an expanded cruise season in certain markets
and itinerary changes for certain ships as well as the acquisition
of Pullmantur.
Onboardand other revenues included concession revenues of
$239.3 million and $234.5 million in 2007 and 2006, respectively.
The increase in concession revenues was primarily due to the
increase in capacity mentioned above.
Expenses
Net Cruise Costs increased 19.8% in 2007 compared to 2006
due to a 12.3% increase in capacity mentioned above and a 6.6%
increase in Net Cruise Costs per APCD. The increase in Net Cruise
Costs per APCD was primarily due to increases in other operating
expenses. Other operating expenses increased primarily due to
the addition of Pullmantur’s tour businesswhich adds costs with-
out corresponding capacity.Gross Cruise Costs increased 20.6%
in 2007 compared to 2006, primarily due to the same reasons
discussed above for Net Cruise Costs.
Depreciation and amortization expenses increased 14.6% in 2007
compared to 2006. The increase was primarily due to the addition
of the Pullmantur fleet and the addition of Liberty of the Seas,
which entered service in May 2007. The increase was also due
tothe incremental depreciation as a result of the addition of
Freedom of the Seas,which entered service in June 2006, shore
side additions and ship improvements.
17
MANAGEMENT’S DISCUSSION AND ANALYSIS OF FINANCIAL
CONDITION AND RESULTS OF OPERATIONS continued