Royal Caribbean Cruise Lines 2007 Annual Report Download - page 17
Download and view the complete annual report
Please find page 17 of the 2007 Royal Caribbean Cruise Lines annual report below. You can navigate through the pages in the report by either clicking on the pages listed below, or by using the keyword search tool below to find specific information within the annual report.-
 1
1 -
2
-
3
-
4
-
5
-
6
-
 7
7 -
 8
8 -
 9
9 -
 10
10 -
 11
11 -
 12
12 -
 13
13 -
 14
14 -
 15
15 -
 16
16 -
 17
17 -
 18
18 -
 19
19 -
 20
20 -
 21
21 -
 22
22 -
 23
23 -
 24
24 -
 25
25 -
 26
26 -
 27
27 -
28
-
29
-
30
-
31
-
32
-
33
-
34
-
35
-
36
-
37
-
38
-
39
-
40
-
41
-
42
-
43
-
44
-
45
-
46
 |
 |

15
MANAGEMENT’S DISCUSSION AND ANALYSIS OF FINANCIAL
CONDITION AND RESULTS OF OPERATIONS continued
From 2003 through 2007, the cruise industry has been adversely
impacted directly and indirectly by substantial increases in fuel
prices. In 2003, fuel cost per metric ton was $204, whereas in 2007,
our fuel cost per metric ton was $455, an increase of 123%. If our
fuel cost per metric ton in 2007 had remained at 2003’s level,
our fuel expenses would have been approximately $300 million
lower in 2007. In addition, fuel and other factors have caused cost
increases elsewhere including transportation, food products and
other commodities. We have been able to partially mitigate this
increase in these costs with our hedging program and energy
saving initiatives. Also, we implemented a temporary fuel supple-
ment in 2008; however, we believe this fuel supplement will be
partially offset by reductions in ticket prices. We believe higher
and volatile fuel prices are a factor that will continue to impact
our results of operations for the foreseeable future. Despite these
pressures, we continue to focus on cost savings initiatives and
expect to limit increases in our Net Cruise Costs on an APCD basis
(excluding fuel) to 1% to 2% in 2008.
The Company expects to continue the expansion of its interna-
tional passenger sourcing and the development and growth of its
innovative fleet of ships. As of December 31, 2007, we had signed
agreements with two shipyards providing for the construction
of seven additional cruise ships. These new ships are expected
to continue to help us maintain our current position within the
worldwide cruise industry. The year-over-year percentage increase
in our capacity for fiscal 2008, 2009, 2010 and 2011, is currently
planned to be 5.1%, 9.3%, 11.4% and 6.4%, respectively.
SUMMARYOF HISTORICAL RESULTS
OF OPERATIONS
Total revenues increased 17.6% to $6.1 billion from total revenues
of $5.2 billion in 2006 primarily due to a 12.3%increase in capacity
and a 4.7% increase in Gross Yields. Net Yields increased by approxi-
mately 3.3% compared to the same period in 2006. The increase
in Net Yields was primarily due to the addition of Pullmantur’s tour
business which provides additional revenues without correspond-
ing capacity and, to a lesser extent, a positive pricing environment.
The increase in total revenues was offset by an increase in expenses
primarily due to the increase in capacity and the acquisition of
Pullmantur as well as an increase in interest expense. As a result,
our net income was $603.4 million or $2.82 per share on a fully
diluted basis in 2007compared to $633.9 million or $2.94 per
share on a fully diluted basis in 2006.
Highlights for 2007included:
• Total revenues increased 17.6% to $6.1 billion from total revenues
of $5.2 billion in 2006 primarily due to a 12.3% increase in capac-
ity and a 4.7% increase in Gross Yields. Net Yields increased by
approximately 3.3% compared to the same period in 2006.
• Net Cruise Costs per APCD increased 6.6% compared to 2006.
• Our Net Debt-to-Capital ratio decreased to 44.7% in 2007 from
46.6% in 2006. Similarly, our Debt-to-Capital ratio decreased
to45.7%in 2007from 47.1% in 2006.
• Weissued €1.0 billion, or approximately $1.3 billion, of 5.625%
senior unsecured notes due 2014 at a price of 99.638% of par.
The net proceeds from the offering were used to retire our
unsecured bridge loan facility obtained to finance our acquisition
of Pullmantur Cruises and to repay a portion of the outstanding
balance on our unsecured revolving credit facility.
• We took delivery of Liberty of the Seas,Royal Caribbean
International’s second Freedom-class ship, which was financed
with a $589.0 million unsecured term loan.
• We placed two additional ship orders, one for Royal Caribbean
International and one for Celebrity Cruises, bringing our total
number of ships on order to seven for an additional capacity
of approximately 25,800 berths.
• We purchased the 1,000-berth Pacific Star and will take posses-
sion of the ship in March 2008 at which time the ship will begin
sailing under the name Ocean Dream.
• We launched a new brand, Azamara Cruises, designed to serve
the emerging deluxe cruise segment of the North American
cruise market. Blue Dream and Blue Moon were redeployed
from Pullmantur Cruises to Azamara Cruises and are sailing under
the names Azamara Journey and Azamara Quest,respectively.
• We redeployed Zenith from Celebrity Cruises to Pullmantur Cruises.
• We amended and restated our unsecured revolving credit facility
to increase the amount available from $1.0 billion to $1.2 billion,
reduce the effective interest rate to LIBOR plus 0.485%, change
the 0.175% commitment fee to a 0.140% facility fee and extend
the maturity datefrom March 27, 2010 to June 29, 2012.
• We launched a second new brand, CDF Croisières de France,
designed to serve the contemporary segment of the French
cruise market with sailings beginning in May 2008. In April 2008,
Holiday Dream will be redeployed from Pullmantur Cruises to CDF
Croisières de France and will sail under the name Bleu de France.
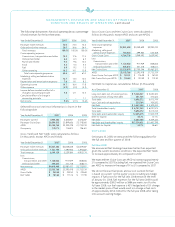
We reported historical total revenues, operating income, income
before cumulative effect of a change in accounting principle,
cumulativeeffect of a change in accounting principle, net income
and earningsper shareas shown in the following table (in thou-
sands, except per share data):
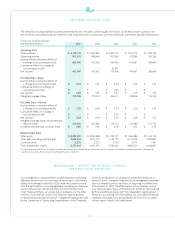
Year Ended December 31, 2007 2006 2005
Total revenues
$6,149,139
$5,229,584 $4,903,174
Operating income
$ 901,335
$ 858,446 $ 871,565
Income before cumulative
effect of a change in
accounting principle
$ 603,405
$ 633,922 $ 663,465
Cumulative effect of a
change in accounting
principle 1
–
– 52,491
Net income
$ 603,405
$ 633,922 $ 715,956
Basic earnings per share:
Income before cumulative
effect of a change in
accounting principle
$ 2.84
$ 3.01 $ 3.22
Cumulativeeffectof a
changein accounting
principle 1
$ –
$ – $ 0.25
Net income
$ 2.84
$ 3.01 $ 3.47
Diluted earnings per share:
Income before cumulative
effect of a change in
accounting principle
$ 2.82
$ 2.94 $ 3.03
Cumulative effect of a
change in accounting
principle 1
$–
$ – $ 0.22
Net income
$ 2.82
$ 2.94 $ 3.26
1In the thirdquarter of 2005, wechanged our method of accounting for drydocking
costs from the accrual in advance to the deferral method (see Note 2. Summary of
Significant Accounting Policies to our consolidated financial statements.)