Royal Caribbean Cruise Lines 2007 Annual Report Download - page 18
Download and view the complete annual report
Please find page 18 of the 2007 Royal Caribbean Cruise Lines annual report below. You can navigate through the pages in the report by either clicking on the pages listed below, or by using the keyword search tool below to find specific information within the annual report.-
 1
1 -
2
-
3
-
4
-
5
-
6
-
7
-
 8
8 -
 9
9 -
 10
10 -
 11
11 -
 12
12 -
 13
13 -
 14
14 -
 15
15 -
 16
16 -
 17
17 -
 18
18 -
 19
19 -
 20
20 -
 21
21 -
 22
22 -
 23
23 -
 24
24 -
 25
25 -
 26
26 -
 27
27 -
 28
28 -
29
-
30
-
31
-
32
-
33
-
34
-
35
-
36
-
37
-
38
-
39
-
40
-
41
-
42
-
43
-
44
-
45
-
46
 |
 |

16
MANAGEMENT’S DISCUSSION AND ANALYSIS OF FINANCIAL
CONDITION AND RESULTS OF OPERATIONS continued
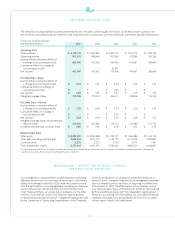
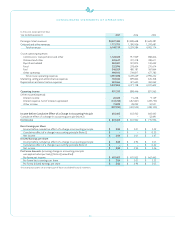
The following table presents historical operating data as a percentage
of total revenues for the last three years:
Year Ended December 31, 2007 2006 2005
Passenger ticket revenues
72.0
73.4 73.6
Onboard and other revenues
28.0
26.6 26.4
Total revenues
100.0%
100.0% 100.0%
Cruise operating expenses
Commissions, transportation and other
18.3
17.6 17.5
Onboard and other
6.6
6.3 6.3
Payroll and related
9.5
9.6 10.4
Food
5.3
5.3 5.5
Fuel
8.9
9.2 7.5
Other operating
16.2
14.1 13.8
Total cruise operating expenses
64.8
62.1 61.0
Marketing, selling and administrative
expenses
12.7
13.4 13.0
Depreciation and amortization expenses
7.8
8.1 8.2
Operating income
14.7
16.4 17.8
Other expense
(4.9)
(4.3) (4.3)
Income before cumulative effect of a
change in accounting principle
9.8
12.1 13.5
Cumulativeeffect of a change in
accounting principle
–
– 1.1
Net income
9.8%
12.1% 14.6%
Selected historical statistical information is shown in the
following table:
Year Ended December 31, 2007 2006 2005
Passengers Carried
3,905,384
3,600,807 3,476,287
Passenger Cruise Days
26,594,515
23,849,606 23,178,560
APCD
25,155,768
22,392,478 21,733,724
Occupancy
105.7%
106.5% 106.6%
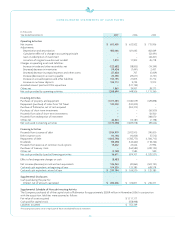
Gross Yields and Net Yields were calculated as follows
(in thousands, except APCD and Yields):
Year Ended December 31, 2007 2006 2005
Passenger ticket revenues
$4,427,384
$3,838,648 $3,609,487
Onboardand other revenues
1,721,755
1,390,936 1,293,687
Total revenues
6,149,139
5,229,584 4,903,174
Less:
Commissions,
transportation and other
1,124,022
917,929 858,606
Onboardand other
405,637
331,218 308,611
Net revenues
$4,619,480
$3,980,437 $3,735,957
APCD
25,155,768
22,392,478 21,733,724
Gross Yields
$ 244.44
$ 233.54 $ 225.60
Net Yields
$ 183.64
$ 177.76 $ 171.90
Gross Cruise Costs and Net Cruise Costs were calculated as
follows (in thousands, except APCD and costs per APCD):
Year Ended December 31, 2007 2006 2005
Total cruise operating
expenses
$3,981,698
$3,249,629 $2,994,232
Marketing, selling and
administrative expenses
783,040
699,864 635,308
Gross Cruise Costs
4,764,738
3,949,493 3,629,540
Less:
Commissions,
transportation and other
1,124,022
917,929 858,606
Onboard and other
405,637
331,218 308,611
Net Cruise Costs
$3,235,079
$2,700,346 $2,462,323
APCD
25,155,768
22,392,478 21,733,724
Gross Cruise Costs per APCD
$ 189.41
$ 176.38 $ 167.00
Net Cruise Costs per APCD
$ 128.60
$ 120.59 $ 113.30
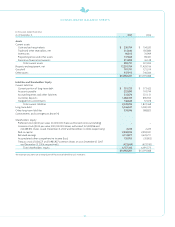
Net Debt-to-Capital was calculated as follows (in thousands):
As of December 31, 2007 2006
Long-term debt, net of current portion
$ 5,346,547
$ 5,040,322
Current portion of long-term debt
351,725
373,422
Total debt
5,698,272
5,413,744
Less: Cash and cash equivalents
230,784
104,520
Net Debt
$ 5,467,488
$ 5,309,224
Total shareholders’ equity
$ 6,757,343
$ 6,091,575
Total debt
5,698,272
5,413,744
Total debt and shareholders’ equity
12,455,615
11,505,319
Debt-to-Capital
45.7%
47.1%
Net Debt
5,467,488
5,309,224
Net Debt and shareholders’equity
$12,224,831
$11,400,799
Net Debt-to-Capital
44.7%
46.6%
OUTLOOK
On January 30, 2008, weannounced the following guidance for
the full year and first quarter of 2008:
Full Year 2008
We announced that bookings have been better than expected
given the current economic conditions. We expected Net Yields
to increase approximately 4% compared to 2007.
We expected Net Cruise Costs per APCD to increase approximately
2% compared to 2007. Excluding fuel, we expected Net Cruise Costs
per APCD to increase in the range of 1% to 2% compared to 2007.
Wedo not forecast fuel prices and our cost outlook for fuel
is based on current “at-the-pump” prices including any hedge
impacts. If fuel prices for the full year 2008 remain at the level
of January 30, 2008, fuel expenses for the full year 2008 would
be approximately $595.0 million or $484 per metric ton. For the
full year 2008, our fuel expense is 45% hedged and a 10% change
in the market price of fuel would result in a change in fuel costs
of approximately $35.0 million for the full year 2008, after taking
into account existing hedges.