Royal Caribbean Cruise Lines 2007 Annual Report Download - page 24
Download and view the complete annual report
Please find page 24 of the 2007 Royal Caribbean Cruise Lines annual report below. You can navigate through the pages in the report by either clicking on the pages listed below, or by using the keyword search tool below to find specific information within the annual report.-
 1
1 -
2
-
3
-
4
-
5
-
6
-
7
-
8
-
9
-
10
-
11
-
12
-
13
-
 14
14 -
 15
15 -
 16
16 -
 17
17 -
 18
18 -
 19
19 -
 20
20 -
 21
21 -
 22
22 -
 23
23 -
 24
24 -
 25
25 -
 26
26 -
 27
27 -
 28
28 -
 29
29 -
 30
30 -
 31
31 -
 32
32 -
 33
33 -
 34
34 -
35
-
36
-
37
-
38
-
39
-
40
-
41
-
42
-
43
-
44
-
45
-
46
 |
 |

22
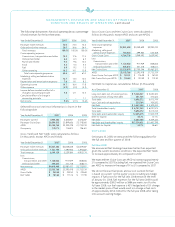
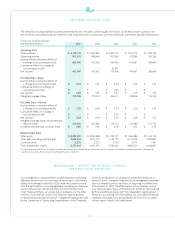
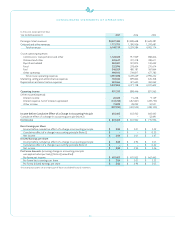
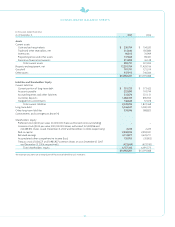
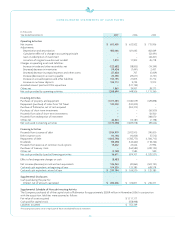
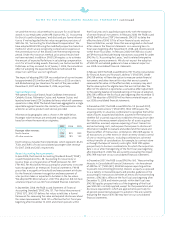
SELECTED FINANCIAL DATA
The selected consolidated financial data presented below for the years 2003 through 2007 and as of the end of each such year, are
derived from our audited financial statements and should be read in conjunction with those financial statements and the related notes.
(in thousands, except per share data)
Year Ended December 31, 2007 2006 2005 2004 2003
Operating Data:
Total revenues
$ 6,149,139
$ 5,229,584 $ 4,903,174 $ 4,555,375 $ 3,784,249
Operating income
901,335
858,446 871,565 753,589 526,185
Income before cumulative effect of
achange in accounting principle
603,405
633,922 663,465 474,691 280,664
Cumulative effect of a change in
accounting principle 1
–
– 52,491 – –
Net income
603,405
633,922 715,956 474,691 280,664
Per Share Data – Basic:
Income before cumulative effect of
achange in accounting principle
$ 2.84
$ 3.01 $ 3.22 $ 2.39 $ 1.45
Cumulative effect of a change in
accounting principle1
$ –
$ – $ 0.25 $ – $ –
Net income
$ 2.84
$ 3.01 $ 3.47 $ 2.39 $ 1.45
Weighted-average shares
212,784
210,703 206,217 198,946 194,074
Per Share Data – Diluted:
Income before cumulative effect of
achangein accounting principle
$ 2.82
$ 2.94 $ 3.03 $ 2.26 $ 1.42
Cumulativeeffect of a change in
accounting principle1
$–
$–$0.22$–$–
Net income
$ 2.82
$ 2.94 $ 3.26 $ 2.26 $ 1.42
Weighted-average shares and potentially
dilutiveshares
214,255
221,485 234,714 234,580 211,175
Dividends declared per common share
$ 0.60
$ 0.60 $ 0.56 $ 0.52 $ 0.52
BalanceSheet Data:
Total assets
$14,982,281
$13,393,088 $11,255,771 $11,964,084 $11,322,742
Total debt, including capital leases
5,698,272
5,413,744 4,154,775 5,731,944 5,835,804
Common stock
2,235
2,225 2,165 2,012 1,961
Total shareholders’ equity
6,757,343
6,091,575 5,554,465 4,804,520 4,262,897
1In the third quarter of 2005, we changed our method of accounting for drydocking costs from the accrual in advance to the deferral method (see Note 2. Summary of
Significant Accounting Policies to our consolidated financial statements.)
MANAGEMENT’S REPORT ON INTERNAL CONTROL
OVER FINANCIAL REPORTING
Our management is responsible for establishing and maintaining
adequate internal control over financial reporting, as such term is
defined in Exchange Act Rule 13a-15(f). Under the supervision and
with the participation of our management, including our Chairman
and Chief ExecutiveOfficer and ExecutiveVice President and
Chief Financial Officer,we conducted an evaluation of the effec-
tiveness of our internal control over financial reporting based
on the framework in Internal Control – Integrated Framework issued
by the Committee of Sponsoring Organizations of the Treadway
Commission. Based on our evaluation under the framework in
Internal Control – Integrated Framework,our management concluded
that our internal control over financial reporting was effective as
of December 31, 2007. The effectiveness of our internal control
over financial reporting as of December 31, 2007 has been audited
by PricewaterhouseCoopers LLP, the independent registered certi-
fied public accounting firm that audited our consolidated financial
statements included in our Annual Report on Form 10-K, as stated
in their report, which is included herein.