Red Lobster 2016 Annual Report Download - page 7
Download and view the complete annual report
Please find page 7 of the 2016 Red Lobster annual report below. You can navigate through the pages in the report by either clicking on the pages listed below, or by using the keyword search tool below to find specific information within the annual report.-
 1
1 -
 2
2 -
 3
3 -
 4
4 -
 5
5 -
 6
6 -
 7
7 -
 8
8 -
 9
9 -
 10
10 -
 11
11 -
 12
12 -
 13
13 -
 14
14 -
 15
15 -
 16
16 -
 17
17 -
 18
18 -
19
-
20
-
21
-
22
-
23
-
24
-
25
-
26
-
27
-
28
-
29
-
30
-
31
-
32
-
33
-
34
-
35
-
36
-
37
-
38
-
39
-
40
-
41
-
42
-
43
-
44
-
45
-
46
-
47
-
48
-
49
-
50
-
51
-
52
-
53
-
54
-
55
-
56
-
57
-
58
-
59
-
60
-
61
-
62
-
63
-
64
 |
 |
DARDEN RESTAURANTS, INC. • 2016 ANNUAL REPORT 3
current trading multiples of both companies, we believe
we have created significant value for shareholders.
Continuing our commitment to enhancing shareholder
value, we returned more than $450 million through dividends
($265 million) and share repurchases ($185 million). As of the
end of the fiscal year, we had $315 million remaining of the
$500 million of share repurchases the Board authorized in
December. This June, we increased our quarterly dividend
to $0.56 per share. With this increase, the Darden dividend
after the real estate spino will be greater than the Darden
dividend before the real estate transaction was completed.
We continued to leverage our scale through aggressive
cost management programs and supply chain optimization.
This, combined with operational simplification and better
overall cost management at the restaurants, enabled
us to deliver $130 million in annual savings since fiscal
2015. We also simplified our organizational structure to
become more decentralized and operations-focused,
with clearer leadership accountability. And across our
portfolio, we increased the sharing of data and insights
on our guests’ needs and preferences to increase
guest trac, drive in-restaurant behavior, enhance the
guest experience and improve financial returns.
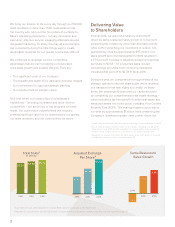
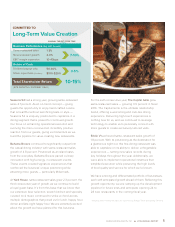
In December, we introduced our value-creation framework.
Our goal over time is to deliver long-term earnings
after tax growth of 7 to 10 percent, derived from:
• Same-restaurant sales growth of 1 to 3 percent
• New restaurant growth of 2 to 3 percent
• EBIT margin expansion of 10 to 40 basis points
We expect to pay out approximately 50 to 60 percent of
our earnings after tax as dividends and repurchase $100
million to $200 million of our shares annually, leading to
a long-term Total Shareholder Return of 10 to 15 percent
— composed of EPS growth and dividend yield.
In summary, we have a value-creating business model
that generates significant and durable cash flow to fund
future growth and return capital to shareholders.
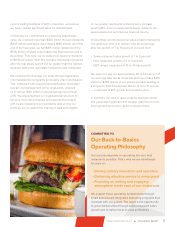
COMMITTED TO
Our Back-to-Basics
Operating Philosophy
Our success depends on operating the very best
restaurants possible. That’s why we are relentlessly
focused on:
• Driving culinary innovation and execution
• Delivering attentive service to every guest
• Providing an inviting and engaging
atmosphere inside each of our restaurants
We support these operating fundamentals through
smart and relevant integrated marketing programs that
resonate with our guests. The result is the opportunity
to grow market share through same-restaurant sales
growth and to deliver best-in-class profitability.