Red Lobster 2016 Annual Report Download - page 10
Download and view the complete annual report
Please find page 10 of the 2016 Red Lobster annual report below. You can navigate through the pages in the report by either clicking on the pages listed below, or by using the keyword search tool below to find specific information within the annual report.
6
Delivering Value to Our Team
Members and Communities
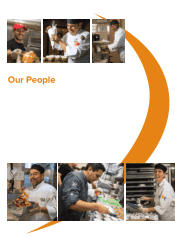
Everything we do starts with people: our 150,000
team members, the nearly one million guests we
serve each day and the individuals who live in the
communities that are home to our restaurants. That’s
why we strive to provide meaningful and rewarding
employment, deliver outstanding food and service to
our guests and give back to our local communities.
For many of our team members, Darden is their first
employer. This is a role we take great pride in – and a
responsibility we take seriously. For some, a job in our
restaurants is the start of a career path to management
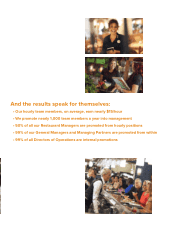
positions within the Company. In fact, half of our
restaurant managers began their careers with us as
hourly team members. For others, it enables them
to further their education and eventually pursue a
career elsewhere. Whatever the case, we know that
the skills and experience we provide will help our team
members grow and succeed within the Company – or
wherever their career paths ultimately take them.
Inclusion and diversity are woven into the fabric of our
culture. Every day we leverage our dierences to support
the business strategy as we create an environment
where all of our team members can reach their greatest
potential. In fact, 52 percent of our team members are
women, and 49 percent are minorities. Additionally, our
team members span five generations – Matures, Baby
Boomers, Generation X, Millennials and Centennials.
We also maintain strong relationships with more than
25 organizations that have a mission to advance diverse
communities. And we’re proud to have been recognized
by the Human Rights Campaign Foundation for scoring
100 percent on the Corporate Equality Index.
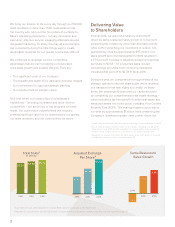
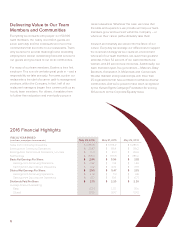
2016 Financial Highlights
FISCAL YEAR ENDED
(in millions, except per share amounts) May 29, 2016 May 31, 2015 May 25, 2014
Sales from Continuing Operations $ 6,933.5 $ 6,764.0 $ 6,285.6
Earnings from Continuing Operations $ 359.7 $ 196.4 $ 183.2
Earnings from Discontinued Operations, net of tax $ 15.3 $ 513.1 $ 103.0
Net Earnings $ 375.0 $ 709.5 $ 286.2
Basic Net Earnings Per Share: $ 2.94 $ 5.56 $ 2.18
Earnings from Continuing Operations $ 2.82 $ 1.54 $ 1.40
Earnings from Discontinued Operations $ 0.12 $ 4.02 $ 0.78
Diluted Net Earnings Per Share: $ 2.90 $ 5.47 $ 2.15
Earnings from Continuing Operations $ 2.78 $ 1.51 $ 1.38
Earnings from Discontinued Operations $ 0.12 $ 3.96 $ 0.77
Dividends Paid Per Share $ 2.10 $ 2.20 $ 2.20
Average Shares Outstanding:
Basic 127.4 127.7 131.0
Diluted 129.3 129.7 133.2


