Red Lobster 2016 Annual Report Download - page 15
Download and view the complete annual report
Please find page 15 of the 2016 Red Lobster annual report below. You can navigate through the pages in the report by either clicking on the pages listed below, or by using the keyword search tool below to find specific information within the annual report.-
 1
1 -
2
-
3
-
4
-
 5
5 -
 6
6 -
 7
7 -
 8
8 -
 9
9 -
 10
10 -
 11
11 -
 12
12 -
 13
13 -
 14
14 -
 15
15 -
 16
16 -
 17
17 -
 18
18 -
 19
19 -
 20
20 -
 21
21 -
 22
22 -
 23
23 -
 24
24 -
 25
25 -
26
-
27
-
28
-
29
-
30
-
31
-
32
-
33
-
34
-
35
-
36
-
37
-
38
-
39
-
40
-
41
-
42
-
43
-
44
-
45
-
46
-
47
-
48
-
49
-
50
-
51
-
52
-
53
-
54
-
55
-
56
-
57
-
58
-
59
-
60
-
61
-
62
-
63
-
64
 |
 |

MANAGEMENT’S DISCUSSION AND ANALYSIS
OF FINANCIAL CONDITION AND RESULTS OF OPERATIONS
DARDEN
DARDEN RESTAURANTS, INC. • 2016 ANNUAL REPORT 11
Increasing same-restaurant sales can improve segment profit because
these incremental sales provide better leverage of our fixed and semi-fixed
restaurant-level costs. A restaurant brand can generate same-restaurant
sales increases through increases in guest traffic, increases in the average
guest check, or a combination of the two. The average guest check can be
impacted by menu price changes and by the mix of menu items sold. For
each restaurant brand, we gather daily sales data and regularly analyze the
guest traffic counts and the mix of menu items sold to aid in developing
menu pricing, product offerings and promotional strategies. We focus on
balancing our pricing and product offerings with other initiatives to produce
sustainable same-restaurant sales growth.
We compute same-restaurant sales using restaurants open at least
16 months because this period is generally required for new restaurant
sales levels to normalize. Sales at newly opened restaurants generally do
not make a significant contribution to profitability in their initial months of
operation due to operating inefficiencies. Our sales and expenses can be
impacted significantly by the number and timing of new restaurant openings
and closings, and relocations and remodeling of existing restaurants.
Pre-opening expenses each period reflect the costs associated with opening
new restaurants in current and future periods.
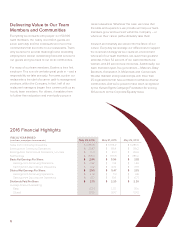
Fiscal 2016 Financial Highlights
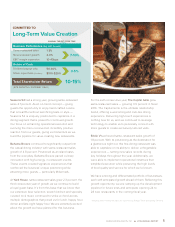
Our sales from continuing operations were $6.93 billion in fiscal 2016
compared to $6.76 billion in fiscal 2015. The 2.5 percent increase in
sales from continuing operations was driven by a combined Darden same-
restaurant sales increase of 3.3 percent on a 52-week basis and the
addition of two net new company-owned restaurants, partially offset by the
impact of the 53rd week of operation in fiscal 2015.
Net earnings from continuing operations for fiscal 2016 were
$359.7 million ($2.78 per diluted share) compared with net earnings from
continuing operations for fiscal 2015 of $196.4 million ($1.51 per diluted
share). Net earnings from continuing operations for fiscal 2016 increased
83.1 percent and diluted net earnings per share from continuing operations
increased 84.1 percent compared with fiscal 2015.
Our net earnings from discontinued operations were $15.3 million
($0.12 per diluted share) for fiscal 2016, compared with net earnings from
discontinued operations of $513.1 million ($3.96 per diluted share) for
fiscal 2015. When combined with results from continuing operations, our
diluted net earnings per share were $2.90 and $5.47 for fiscal 2016 and
2015, respectively.
Outlook
We expect combined Darden same-restaurant sales to increase in fiscal
2017 between 1.0 percent and 2.0 percent, and we expect fiscal 2017
sales from continuing operations to increase between 1.7 percent and
2.7 percent. In fiscal 2017, we expect to open approximately 24 to 28
new restaurants, and we expect capital expenditures incurred to build
new restaurants, remodel and maintain existing restaurants and technology
initiatives to be between $310.0 million and $350.0 million.
In June 2016, we announced a quarterly dividend of $0.56 per share,
payable on August 1, 2016. Based on the $0.56 quarterly dividend decla-
ration, our expected annual dividend is $2.24 per share, which reflects
an increase of 6.7 percent compared to our fiscal 2016 annual dividend.
Dividends are subject to the approval of our Board of Directors and,
accordingly, the timing and amount of our dividends are subject to change.
There are significant risks and challenges that could impact our
operations and ability to increase sales and earnings. The restaurant industry
is intensely competitive and sensitive to economic cycles and other business
factors, including changes in consumer tastes and dietary habits. Other
risks and uncertainties are discussed and referenced in the subsection below
entitled “Forward-Looking Statements.”