Red Lobster 2016 Annual Report Download - page 6
Download and view the complete annual report
Please find page 6 of the 2016 Red Lobster annual report below. You can navigate through the pages in the report by either clicking on the pages listed below, or by using the keyword search tool below to find specific information within the annual report.-
 1
1 -
 2
2 -
 3
3 -
 4
4 -
 5
5 -
 6
6 -
 7
7 -
 8
8 -
 9
9 -
 10
10 -
 11
11 -
 12
12 -
 13
13 -
 14
14 -
 15
15 -
 16
16 -
 17
17 -
18
-
19
-
20
-
21
-
22
-
23
-
24
-
25
-
26
-
27
-
28
-
29
-
30
-
31
-
32
-
33
-
34
-
35
-
36
-
37
-
38
-
39
-
40
-
41
-
42
-
43
-
44
-
45
-
46
-
47
-
48
-
49
-
50
-
51
-
52
-
53
-
54
-
55
-
56
-
57
-
58
-
59
-
60
-
61
-
62
-
63
-
64
 |
 |

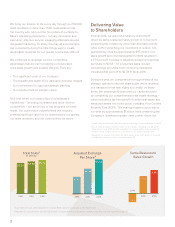
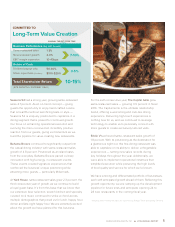
1 Total Sales in fiscal 2015 adjusted to exclude $125 million in sales due to the 53rd week.
2 Adjusted for special items and the 53rd week. A reconciliation of reported to adjusted numbers can be found on page 57.
Total Sales
(in billions)
201420152016
$6.29 $6.64 $6.93
Adjusted Earnings
Per Share
201420152016
$1.71
$2.56
$3.53
Same-Restaurant
Sales Growth
2014
20152016
-1.3%
2.4%
3.3%
1 Industry same-restaurant sales as reported by Knapp-Track (excluding Darden).
2 Fiscal 2015 included an extra week of operations, resulting in a 53-week
fiscal year. Fiscal 2016 growth excludes the impact of the extra operating
week in fiscal 2015 to allow for a 52-week to 52-week comparison.
3 Adjusted for special items and the 53rd week. A reconciliation of reported
to adjusted numbers can be found on page 57.
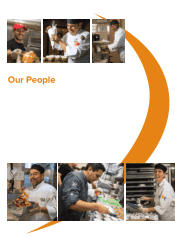
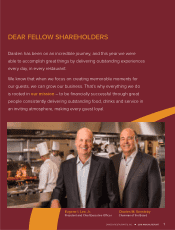
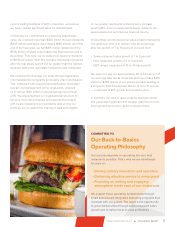
We bring our mission to life every day through our 150,000
team members in more than 1,500 restaurants across
the country who carry out the four pillars of our Back-to-
Basics operating philosophy – culinary innovation and
execution, attentive service, engaging atmospheres and
integrated marketing. To many, this may all sound simple,
but consistently doing the little things well to create
memorable moments for our guests is extremely dicult.
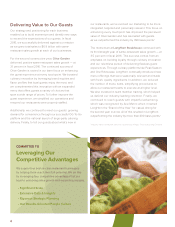
We continued to leverage our four competitive
advantages that are key to helping our businesses
drive sales growth and expand margins. They are:
• The significant scale of our Company
• The breadth and depth of our data and consumer insights
• Our commitment to rigorous strategic planning
• Our results-oriented, people culture
At a time when our industry faced considerable
headwinds – including increased and more diverse
competition – we are proud of the progress we have
made. Our businesses outperformed the industry1,
creating significant value for our shareholders, our guests,
our team members and the communities we serve.
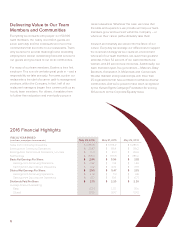
Delivering Value
to Shareholders
In fiscal 2016, we grew total sales by 4.4 percent2
driven by same-restaurant sales growth of 3.3 percent –
exceeding the industry by more than 400 basis points1
while further simplifying our operations to reduce non-
guest-facing costs by approximately $95 million. Our
sales growth and cost management eorts resulted in
a 37.9 percent increase in adjusted diluted net earnings
per share to $3.53.3 On a reported basis, diluted
net earnings per share from continuing operations
increased 84.1 percent to $2.78 in fiscal 2016.
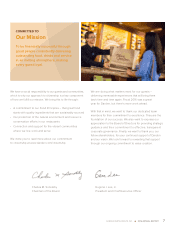
During the year, we completed a thorough review of our
strategic options to improve shareholder return resulting
in a transaction that was highly successful on many
fronts. We meaningfully improved our capital structure
by completing our comprehensive real estate strategy –
which included a tax-free spino of certain real estate and
restaurant assets into a new public company, Four Corners
Property Trust (FCPT). This strategy enabled us to reduce
our debt by approximately $1 billion while preserving the
Company’s investment-grade credit profile. Given the
2