Red Lobster 2016 Annual Report Download
Download and view the complete annual report
Please find the complete 2016 Red Lobster annual report below. You can navigate through the pages in the report by either clicking on the pages listed below, or by using the keyword search tool below to find specific information within the annual report.-
 1
1 -
 2
2 -
 3
3 -
 4
4 -
 5
5 -
 6
6 -
 7
7 -
 8
8 -
 9
9 -
 10
10 -
 11
11 -
 12
12 -
13
-
14
-
15
-
16
-
17
-
18
-
19
-
20
-
21
-
22
-
23
-
24
-
25
-
26
-
27
-
28
-
29
-
30
-
31
-
32
-
33
-
34
-
35
-
36
-
37
-
38
-
39
-
40
-
41
-
42
-
43
-
44
-
45
-
46
-
47
-
48
-
49
-
50
-
51
-
52
-
53
-
54
-
55
-
56
-
57
-
58
-
59
-
60
-
61
-
62
-
63
-
64
 |
 |

OUR
COMMITMENT
TO YOU
2016 ANNUAL REPORT
Table of contents
-
Page 1
OUR COMMITMENT TO YOU 2016 ANNUAL REPORT -
Page 2
... people who crave a flavorful, boldly seasoned steak in a down-to-earth setting that feels like a rancher's home. $1.6 billion in sales 481 units The restaurant of choice for conscientious adults celebrating the goodness of life without compromise. $254 million in sales 40 units The destination to... -
Page 3
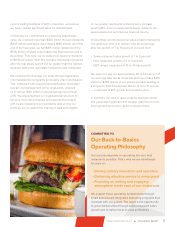
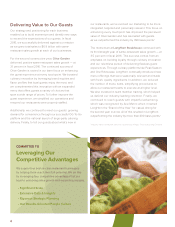
COMMITTED TO Our People We are a restaurant company, so food is always top of mind. But what we do starts with people. Our 150,000 team members are what make the difference at Darden - they are at the heart of everything we do. That's why we strive to hire the best and create an inclusive ... -
Page 4
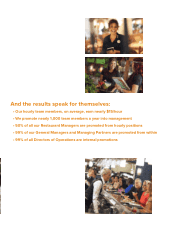
...000 leadership positions across our restaurants, we provide a pathway for thousands of individuals throughout the country to advance from entry-level jobs into management roles. It's one of the reasons Darden enjoys the lowest annual turnover rates for hourly team members in the industry - 30 points... -
Page 5
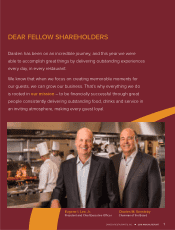
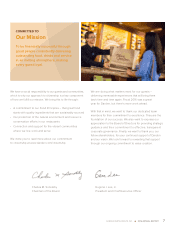
... successful through great people consistently delivering outstanding food, drinks and service in an inviting atmosphere, making every guest loyal. Eugene I. Lee, Jr. President and Chief Executive Officer Charles M. Sonsteby Chairman of the Board DARDEN RESTAURANTS, INC. • 2016 ANNUAL REPORT... -
Page 6
... $3.53.3 On a reported basis, diluted net earnings per share from continuing operations increased 84.1 percent to $2.78 in fiscal 2016. During the year, we completed a thorough review of our strategic options to improve shareholder return resulting in a transaction that was highly successful on many... -
Page 7
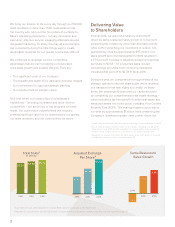
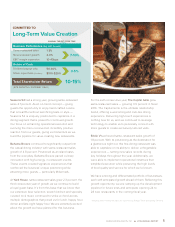
... our value-creation framework. Our goal over time is to deliver long-term earnings after tax growth of 7 to 10 percent, derived from: • Same-restaurant sales growth of 1 to 3 percent • New restaurant growth of 2 to 3 percent • EBIT margin expansion of 10 to 40 basis points We expect to pay out... -
Page 8
... new ways to exceed the expectations of our guests. In fiscal 2016, we successfully delivered against our mission as we grew total sales to $6.9 billion with samerestaurant sales growth at each of our businesses. For the second consecutive year, Olive Garden delivered positive same-restaurant sales... -
Page 9
...Long-Term Value Creation ANNUAL TARGET, OVER TIME Business Performance (Adj. EAT Growth) Same-restaurant sales New restaurant growth EBIT margin expansion 1-3% 2-3% 10-40bps 50-60% $100-$200 7-10% Return of Cash Dividend payout ratio Share repurchase ($ millions) 3-5% Total Shareholder Return... -
Page 10
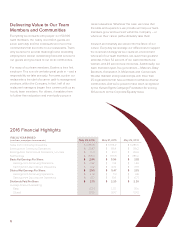
... back to our local communities. For many of our team members, Darden is their first employer. This is a role we take great pride in - and a responsibility we take seriously. For some, a job in our restaurants is the start of a career path to management positions within the Company. In fact, half of... -
Page 11
... for your continued support of Darden and our vision. We look forward to rewarding that support through our ongoing commitment to value creation. Charles M. Sonsteby Chairman of the Board Eugene I. Lee, Jr. President and Chief Executive Officer DARDEN RESTAURANTS, INC. • 2016 ANNUAL REPORT 7 -
Page 12
... Chief Financial Officer Chris Chang Senior Vice President Chief Information Officer Susan Connelly Senior Vice President Communications & Corporate Affairs Brian Foye President Seasons 52 Dave George President Olive Garden Executive Vice President Darden Restaurants Danielle Kirgan Senior... -
Page 13
Darden Restaurants, Inc. 2016 Financial Review 10 22 22 23 24 25 25 26 27 28 29 56 Management's Discussion and Analysis of Financial Condition and Results of Operations Report of Management's Responsibilities Management's Report on Internal Control Over Financial Reporting Report of Independent ... -
Page 14
...operational and brand-building imperatives, we expect to increase our market share through new restaurant and same-restaurant sales growth and deliver best-in-class profitability. The Darden support structure enables our brands to achieve their ultimate potential by: (1) driving advantages in supply... -
Page 15
... by the number and timing of new restaurant openings and closings, and relocations and remodeling of existing restaurants. Pre-opening expenses each period reflect the costs associated with opening new restaurants in current and future periods. Fiscal 2016 Financial Highlights Our sales from... -
Page 16
... of tax Net earnings (1) Effective tax rate The following table details the number of company-owned restaurants currently reported in continuing operations, compared with the number open at the end of fiscal 2015 and the end of fiscal 2014. May 29, 2016 Olive Garden LongHorn Steakhouse Yard House... -
Page 17
... fiscal years ended May 29, 2016, May 31, 2015 and May 25, 2014. Additionally, this information and the following analysis have been presented with the results of operations, costs incurred in connection with the sale and related gain on the sale of Red Lobster and results for the two closed synergy... -
Page 18
... by pricing and favorable menu mix. • Restaurant labor costs decreased as a percent of sales primarily as a result of sales leverage. • Restaurant expenses (which include utilities, repairs and maintenance, credit card, lease, property tax, workers' compensation, new restaurant pre-opening, rent... -
Page 19
... costs during fiscal 2015 and fiscal 2014 and were able to partially reduce the annual impact utilizing these strategies. CRITICAL ACCOUNTING ESTIMATES SEGMENT RESULTS We manage our restaurant brands, Olive Garden, LongHorn Steakhouse, The Capital Grille, Yard House, Bahama Breeze, Seasons... -
Page 20
MANAGEMENT'S DISCUSSION AND ANALYSIS OF FINANCIAL CONDITION AND RESULTS OF OPERATIONS DARDEN impairment loss. Based on a review of operating results for each of our restaurants, the amount of net book value associated with lower performing restaurants that would be deemed at risk for impairment is ... -
Page 21
... needs. We currently manage our business and financial ratios to target an investment-grade bond rating, which has historically allowed flexible access to financing at reasonable costs. Currently, our publicly issued long-term debt carries "Baa3" (Moody's Investors Service), "BBB" (Standard & Poor... -
Page 22
... OF FINANCIAL CONDITION AND RESULTS OF OPERATIONS DARDEN During fiscal 2016, utilizing the proceeds of the Four Corners cash dividend, cash proceeds from the sale-leasebacks of restaurant properties and our corporate headquarters and additional cash on hand, we retired approximately $1.03 billion... -
Page 23
... proceeds from the exercise of employee stock options. Net cash flows used in financing activities in fiscal 2015 reflected long-term debt payments of $1.07 billion, including repurchase premiums and make-whole provisions, dividend payments of $278.9 million, share repurchases of $502.3 million and... -
Page 24
... financial statements). We use the variance/covariance method to measure value at risk, over time horizons ranging from one week to one year, at the 95 percent confidence level. At May 29, 2016, our potential losses in future net earnings resulting from changes in foreign currency exchange rate... -
Page 25
...earnings per share growth, and capital expenditures in fiscal 2017, and all other statements that are not historical facts, including without limitation statements with respect to the financial condition, results of operations, plans, objectives, future performance and business of Darden Restaurants... -
Page 26
... inadequate because of changes in conditions, or that the degree of compliance with the policies or procedures may deteriorate. Management assessed the effectiveness of the Company's internal control over financial reporting as of May 29, 2016. In making this assessment, management used the criteria... -
Page 27
... accordance with the standards of the Public Company Accounting Oversight Board (United States), the consolidated balance sheets of Darden Restaurants, Inc. as of May 29, 2016 and May 31, 2015, and the related consolidated statements of earnings, comprehensive income, changes in stockholders' equity... -
Page 28
...the three-year period ended May 29, 2016, in conformity with U.S. generally accepted accounting principles. We also have audited, in accordance with the standards of the Public Company Accounting Oversight Board (United States), Darden Restaurants, Inc.'s internal control over financial reporting as... -
Page 29
CONSOLIDATED STATEMENTS OF EARNINGS DARDEN (in millions, except per share data) May 29, 2016 Fiscal Year Ended May 31, 2015 May 25, 2014 Sales Costs and expenses: Food and beverage Restaurant labor Restaurant expenses Marketing expenses General and administrative expenses Depreciation and ... -
Page 30
...BALANCE SHEETS DARDEN (in millions) May 29, 2016 May 31, 2015 ASSETS Current assets: Cash and cash equivalents Receivables, net Inventories Prepaid income taxes Prepaid expenses and other current assets Deferred income taxes Assets held for sale Total current assets Land, buildings and equipment... -
Page 31
... share) Stock option exercises (1.8 shares) Stock-based compensation ESOP note receivable repayments Income tax benefits credited to equity Repurchases of common stock (0.0 shares) Issuance of stock under Employee Stock Purchase Plan and other plans (0.2 shares) Balances at May 25, 2014 Net earnings... -
Page 32
..., net Amortization of loan costs and losses on interest-rate related derivatives Stock-based compensation expense Change in current assets and liabilities Contributions to pension and postretirement plans Change in cash surrender value of trust-owned life insurance Deferred income taxes Change in... -
Page 33
...-term investments Credit card receivables Depository accounts Total Cash and Cash Equivalents BASIS OF PRESENTATION On May 15, 2014, we entered into an agreement to sell Red Lobster and certain related assets and associated liabilities and closed the sale on July 28, 2014. For fiscal 2016, 2015... -
Page 34
... lives ranging from 7 to 40 years using the straight-line method. Leasehold improvements, which are reflected on our consolidated balance sheets as a component of buildings in land, buildings and equipment, net, are amortized over the lesser of the expected lease term, including cancelable option... -
Page 35
...is discounted using a weighted-average cost of capital that reflects current market conditions. The projection uses management's best estimates of economic and market conditions over the projected period including growth rates in sales, costs and number of units, estimates of future expected changes... -
Page 36
... consolidated statements of earnings, represents food and beverage product sold and is presented net of discounts, coupons, employee meals and complimentary meals. Revenue from restaurant sales is recognized when food and beverage products are sold. Sales taxes collected from customers and remitted... -
Page 37
...are charged to operations in the fiscal period incurred and reported as marketing expenses on our consolidated statements of earnings. STOCK-BASED COMPENSATION We recognize the cost of employee service received in exchange for awards of equity instruments based on the grant date fair value of those... -
Page 38
... Canadian restaurant operations and the Malaysian ringgit is the functional currency for our franchises based in Malaysia. Assets and liabilities denominated in foreign currencies are translated into U.S. dollars using the exchange rates in effect at the balance sheet date. Results of operations are... -
Page 39
... two years from the date of sale with minimal impact to our cash flows. In total, we have recognized a pre-tax gain on the sale of Red Lobster of $854.8 million, which is included in earnings from discontinued operations in our consolidated statements of earnings. For fiscal 2016, 2015 and 2014, all... -
Page 40
... $ 3,215.8 (1) Amounts for fiscal years 2016 and 2015 primarily relate to the gain recognized on the sale of Red Lobster. Assets classified as held for sale on our accompanying consolidated balance sheets as of May 29, 2016, consisted of land, buildings and equipment with carrying amounts of $20... -
Page 41
..., net Purchases of land, buildings and equipment LongHorn Steakhouse $1,383.9 1,179.6 $ 204.3 $ 66.7 0.8 114.4 Other Business $ 817.0 707.9 $ 109.1 $ 42.7 3.7 123.1 Corporate 21.1 3.8 3.1 Reconciliation of segment profit to earnings from continuing operations before income taxes: Fiscal Year... -
Page 42
... current portion Long-term debt, excluding current portion During fiscal 2016, utilizing the proceeds of the Four Corners cash dividend, cash proceeds from the sale-leasebacks of restaurant properties and our corporate headquarters and additional cash on hand, we retired approximately $1.03 billion... -
Page 43
... shares. These amounts are recognized currently in earnings as they are incurred or received. We entered into equity forward contracts to hedge the risk of changes in future cash flows associated with recognized, cash-settled performance stock units and employee-directed investments in Darden stock... -
Page 44
...statements of earnings are as follows: Amount of Gain (Loss) Recognized in Earnings Fiscal Year (in millions) Location of Gain (Loss) Recognized in Earnings 2016 $ 3.9 7.5 $11.4 2015 $ 4.0 9.2 $13.2 2014 $(0.5) (1.3) $(1.8) Equity forwards Equity forwards Restaurant labor expenses General and... -
Page 45
... Gains (Losses) on Derivatives Benefit Plan Accumulated Other Funding Position Comprehensive Income (Loss) Balances at May 25, 2014 Gain (loss) Reclassification realized in net earnings Balances at May 31, 2015 Gain (loss) Reclassification realized in net earnings Balances at May 29, 2016... -
Page 46
... net periodic benefit costs - other plans, which is a component of general and administrative expenses. NOTE 11 LEASES An analysis of rent expense incurred related to continuing operations is as follows: Fiscal Year (in millions) 2016 2015 2014 Restaurant minimum rent (1) Restaurant rent averaging... -
Page 47
... $68.7 million and $44.0 million, respectively, of payments associated with the retirement of long-term debt. See Note 7. (2) Income taxes paid in fiscal 2015 were higher primarily as a result of the gain recognized on the sale of Red Lobster. DARDEN RESTAURANTS, INC. • 2016 ANNUAL REPORT 43 -
Page 48
... benefits, excluding the release of accrued interest related to prior year matters due to settlement or the lapse of the statute of limitations was as follows: Fiscal Year 2015 $1.1 Accrued liabilities Compensation and employee benefits Deferred rent and interest income Net operating loss, credit... -
Page 49
... at end of period Change in Plan Assets: Fair value at beginning of period Actual return on plan assets Employer contributions Plan settlements Participant contributions Benefits paid Fair value at end of period Unfunded status at end of period DARDEN RESTAURANTS, INC. • 2016 ANNUAL REPORT 45 -
Page 50
... Plans 2016 2015 Weighted-average assumptions used to determine benefit obligations at May 29 and May 31 (1) Discount rate Rate of future compensation increases Weighted-average assumptions used to determine net expense for fiscal years ended May 29 and May 31 (2) Discount rate Expected long-term... -
Page 51
... results, an analysis of current market conditions, asset fund allocations and the views of leading financial advisers and economists. We reduced our expected long-term rate of return on plan assets for our defined benefit plans from 8.0 percent used in fiscal 2014 to 7.0 percent used in fiscal 2015... -
Page 52
... FINANCIAL STATEMENTS DARDEN Components of net periodic benefit cost included in earnings are as follows: 2016 $ - 10.6 (14.5) - 2.8 - - $ (1.1) Defined Benefit Plans 2015 2014 $ 1.1 10.0 (15.2) - 2.6 6.1 - $ 4.6 $ 4.4 10.2 (17.1) 0.1 9.0 - (0.5) $ 6.1 2016 Postretirement Benefit Plan 2015 2014... -
Page 53
...following benefit payments are expected to be paid between fiscal 2017 and fiscal 2026: (in millions) Defined Benefit Plans $12.5 12.6 13.0 13.7 14.2 79.3 Postretirement Benefit Plan $1.3 1.3 1.3 1.3 1.3 6.2 2017 2018 2019 2020 2021 2022-2026 DARDEN RESTAURANTS, INC. • 2016 ANNUAL REPORT 49 -
Page 54
...the dividends accumulated on unallocated shares held by the ESOP, are used to pay principal, interest and expenses of the plan. As loan payments are made, common stock is allocated to ESOP participants. In each of the fiscal years 2016, 2015 and 2014, the ESOP used dividends received of $0.7 million... -
Page 55
... change in mix of equity awards granted. (2) The higher expense in fiscal 2015 is primarily attributable to the workforce reduction efforts (see Note 16) and the impact of improved financial performance. The weighted-average fair value of non-qualified stock options and the related assumptions used... -
Page 56
... of unrecognized compensation cost related to unvested restricted stock and RSUs granted under our stock plans. This cost is expected to be recognized over a weighted-average period of 2.3 years. The total fair value of restricted stock and RSUs that vested during fiscal 2016, 2015 and 2014 was... -
Page 57
...common stock on either the first or last trading day of each calendar quarter, whichever is lower. Cash received from employees pursuant to the plan during fiscal 2016, 2015 and 2014 was $4.8 million, $5.2 million and $7.2 million, respectively. DARDEN RESTAURANTS, INC. • 2016 ANNUAL REPORT 53 -
Page 58
..., 2016: (in millions) Fiscal Year 2014 Plans $13.4 1.1 $14.5 Fiscal Year 2015 Plans $24.2 0.6 $24.8 Payments $(35.9) (1.3) $(37.2) Adjustments $ 0.9 (0.3) $ 0.6 Balance at May 29, 2016 $2.6 0.1 $2.7 Employee termination benefits (1) Other Total (1) Excludes costs associated with stock options... -
Page 59
...share Stock price: High Low (1) The quarter ended May 31, 2015, consisted of 14 weeks, while all other quarters consisted of 13 weeks. (2) The year ended May 31, 2015, consisted of 53 weeks, while the year ended May 29, 2016, consisted of 52 weeks. DARDEN RESTAURANTS, INC. • 2016 ANNUAL REPORT... -
Page 60
... consolidated financial statements, information has been presented on a continuing operations basis. Accordingly, the activities related to Red Lobster, two closed company-owned synergy restaurants, Smokey Bones, Rocky River Grillhouse and the nine Bahama Breeze restaurants closed or sold in fiscal... -
Page 61
NON-GAAP RECONCILIATIONS DARDEN Reported to Adjusted Diluted Net Earnings Per Share Reconciliations ANNUAL Fiscal 2014 Reported Diluted Net EPS from Continuing Operations Real Estate Plan Implementation Debt Retirement Costs Strategic Action Plan and Other Costs Adjusted Diluted Net EPS from ... -
Page 62
... obtained by visiting our website at www.darden.com. Annual reports, SEC filings, press releases and other Company news are readily available on the website. Our website also includes corporate governance information, including our Corporate Governance Guidelines, Code of Business Conduct and Ethics... -
Page 63
...-Founder and Managing Director of Chetrum Capital LLC, a private investment firm. Jean M. Birch Retired Chief Executive Officer and President of Birch Company, LLC, a specialized strategy and leadership consulting firm focused on the hospitality industry. Bradley D. Blum Founder and Owner of BLUM... -
Page 64
1000 Darden Center Drive Orlando, FL 32837 407-245-4000 www.darden.com