Red Lobster 2014 Annual Report Download - page 9
Download and view the complete annual report
Please find page 9 of the 2014 Red Lobster annual report below. You can navigate through the pages in the report by either clicking on the pages listed below, or by using the keyword search tool below to find specific information within the annual report.-
 1
1 -
 2
2 -
 3
3 -
 4
4 -
 5
5 -
 6
6 -
 7
7 -
 8
8 -
 9
9 -
 10
10 -
 11
11 -
 12
12 -
 13
13 -
 14
14 -
 15
15 -
 16
16 -
 17
17 -
 18
18 -
 19
19 -
 20
20 -
21
-
22
-
23
-
24
-
25
-
26
-
27
-
28
-
29
-
30
-
31
-
32
-
33
-
34
-
35
-
36
-
37
-
38
-
39
-
40
-
41
-
42
-
43
-
44
-
45
-
46
-
47
-
48
-
49
-
50
-
51
-
52
-
53
-
54
-
55
-
56
-
57
-
58
-
59
-
60
 |
 |

Management’s Discussion and Analysis
of Financial Condition and Results of Operations
Darden
2014 Annual Report 7
Outlook and Strategy
We expect same-restaurant sales in fiscal 2015 to range from flat to an
increase of 1.0 percent for Olive Garden and an increase of 1.0 percent to
2.0 percent for LongHorn Steakhouse. We expect a blended same-restaurant
sales increase for The Capital Grille, Bahama Breeze, Seasons 52, Eddie V’s
and Yard House of approximately 2.0 percent. Total sales from continuing
operations in fiscal 2015 are expected to increase between 5.0 percent and
7.0 percent, including the impact of the 53rd week in fiscal 2015. We expect
food and beverage expenses to be higher as a percent of sales based on our
expectations of food cost inflation. We also expect restaurant labor expenses
to be higher as a percent of sales based on our expectations that manager
incentive compensation will return to normal levels. Excluding the impact of
costs we expect to incur in connection with the Red Lobster separation in
fiscal 2015, as well as costs related to our lobster aquaculture research and
development project, we expect general and administrative expenses as a
percent of sales to remain consistent with fiscal 2014. This is primarily due
to cost savings generated from actions taken as a result of our restaurant sup-
port platform review. We expect our remaining expense line items, restaurant
expenses and depreciation expense, to be relatively flat as a percent of sales.
We expect diluted net earnings per share from continuing operations for fiscal
2015 to be above fiscal 2014 by between 30.0 percent and 35.0 percent,
including the impact of the 53rd week. In fiscal 2015, we expect to add
approximately 35-40 net new restaurants, and we expect capital expenditures
incurred to build new restaurants and remodel existing restaurants to be
between $325.0 million and $350.0 million.
In June 2014, we announced a quarterly dividend of $0.55 per share,
payable on August 1, 2014. Based on the $0.55 quarterly dividend declaration,
our expected annual dividend is $2.20 per share, which is consistent with
our fiscal 2014 annual dividend. Dividends are subject to the approval of our
Board of Directors and, accordingly, the timing and amount of our dividends
are subject to change.
During fiscal 2015, we are focused on progressing with our value creation
priorities, which include: completion of the Red Lobster sale; continuation of
the Olive Garden “brand renaissance”; continuation of new restaurant growth
at our other brands, primarily driven by LongHorn; implementation of a new
management incentive plan that more directly emphasizes same-restaurant
sales, free cash flow and relative total shareholder return; continuation of the
focus on our restaurant support platform costs; and improvement on capital
allocation discipline.
The total sales growth we envision should increase the cost-effectiveness
of our restaurant support platform. However, we also plan to supplement our
conventional incremental year-to-year cost management efforts with an
ongoing focus on identifying and pursuing transformational multi-year cost
reduction opportunities.
There are significant risks and challenges that could impact our operations
and ability to increase sales and earnings. The full-service restaurant industry
is intensely competitive and sensitive to economic cycles and other business
factors, including changes in consumer tastes and dietary habits. Other risks
and uncertainties are discussed and referenced in the subsection below
entitled “Forward-Looking Statements.”
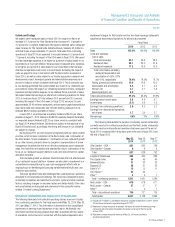
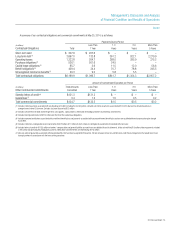
RESULTS OF OPERATIONS FOR FISCAL 2014, 2013 AND 2012
The following table sets forth selected operating data as a percent of sales
from continuing operations for the fiscal years ended May 25, 2014, May 26,
2013 and May 27, 2012. This information is derived from the consolidated
statements of earnings found elsewhere in this report. Additionally, this
information and the following analysis have been presented with the results
of operations, costs incurred in connection with the planned separation and
impairment charges for Red Lobster and the two closed synergy restaurants
classified as discontinued operations for all periods presented.
Fiscal Years
2014 2013 2012
Sales 100.0% 100.0% 100.0%
Costs and expenses:
Cost of sales:
Food and beverage 30.1 29.4 29.2
Restaurant labor 32.1 32.0 31.6
Restaurant expenses 17.2 16.6 15.9
Total cost of sales, excluding
restaurant depreciation and
amortization of 4.5%, 4.3%
and 4.1%, respectively 79.4% 78.0% 76.7%
Selling, general and administrative 10.6 10.6 10.2
Depreciation and amortization 4.8 4.7 4.5
Interest, net 2.1 2.1 1.9
Asset impairment, net 0.3 – –
Total costs and expenses 97.2% 95.4% 93.3%
Earnings before income taxes 2.8 4.6 6.7
Income taxes (0.1) 0.6 1.5
Earnings from continuing operations 2.9 4.0 5.2
Earnings from discontinued operations,
net of taxes 1.7 3.0 3.7
Net earnings 4.6% 7.0% 8.9%
The following table details the number of company-owned restaurants
currently reported in continuing operations and the Red Lobster restaurants
currently reported in discontinued operations that were open at the end of
fiscal 2014, compared with the number open at the end of fiscal 2013 and
the end of fiscal 2012.
May 25, May 26, May 27,
2014 2013 2012
Olive Garden – USA 831 822 786
Olive Garden – Canada 6 6 6
Total 837 828 792
LongHorn Steakhouse 464 430 386
The Capital Grille 54 49 46
Bahama Breeze 37 33 30
Seasons 52 38 31 23
Eddie V’s (1) 15 12 11
Yard House (1) 52 44 –
Other (2) 4 4 1
Total – continuing operations 1,501 1,431 1,289
Red Lobster – USA 679 678 677
Red Lobster – Canada 27 27 27
Other (3) – 2 1
Total – discontinued operations 706 707 705
Total Darden 2,207 2,138 1,994
(1) Includes the 11 Eddie V’s and Wildfish restaurants acquired on November 14, 2011 and the
40 Yard House restaurants acquired on August 29, 2012.
(2) Represents synergy restaurants in operation. We expect to convert all remaining synergy
restaurants into stand-alone Olive Garden restaurants by the end of the first quarter
of fiscal 2015.
(3) Represents synergy restaurants closed as of May 25, 2014 and classified as
discontinued operations.