Red Lobster 2014 Annual Report Download - page 49
Download and view the complete annual report
Please find page 49 of the 2014 Red Lobster annual report below. You can navigate through the pages in the report by either clicking on the pages listed below, or by using the keyword search tool below to find specific information within the annual report.-
 1
1 -
2
-
3
-
4
-
5
-
6
-
7
-
8
-
9
-
10
-
11
-
12
-
13
-
14
-
15
-
16
-
17
-
18
-
19
-
20
-
21
-
22
-
23
-
24
-
25
-
26
-
27
-
28
-
29
-
30
-
31
-
32
-
33
-
34
-
35
-
36
-
37
-
38
-
 39
39 -
 40
40 -
 41
41 -
 42
42 -
 43
43 -
 44
44 -
 45
45 -
 46
46 -
 47
47 -
 48
48 -
 49
49 -
 50
50 -
 51
51 -
 52
52 -
 53
53 -
 54
54 -
 55
55 -
 56
56 -
 57
57 -
 58
58 -
 59
59 -
60
 |
 |

Notes to Consolidated Financial Statements
Darden
2014 Annual Report 47
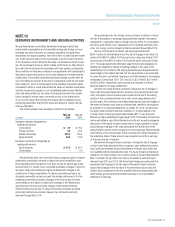
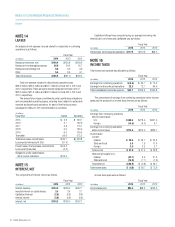
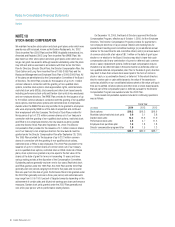
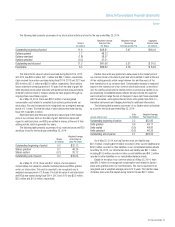
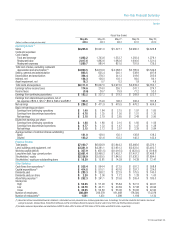
Components of net periodic benefit cost included in continuing operations are as follows:
Defined Benefit Plans Postretirement Benefit Plan
(in millions)
2014 2013 2012 2014 2013 2012
Service cost $ 4.4 $ 4.7 $ 5.1 $ 0.7 $ 0.8 $ 0.8
Interest cost 10.2 9.9 9.6 1.4 1.3 1.5
Expected return on plan assets (17.1) (19.4) (17.8) – – –
Amortization of unrecognized prior service cost 0.1 0.1 0.1 (0.1) (0.1) (0.1)
Recognized net actuarial loss 9.0 8.8 8.2 – – –
Curt ailment gain recognized (0.5) – – – – –
Net pension and postretirement cost (benefit) $ 6.1 $ 4.1 $ 5.2 $ 2.0 $ 2.0 $ 2.2
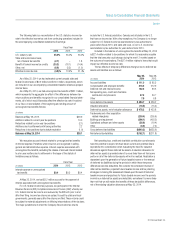
The amortization of the net actuarial loss component of our fiscal 2015 net periodic benefit cost for the defined benefit plans and postretirement benefit
plan is expected to be approximately $2.6 million and $0.5 million, respectively.
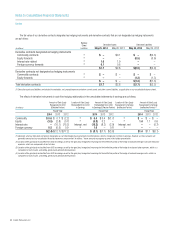
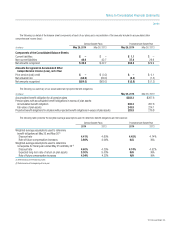
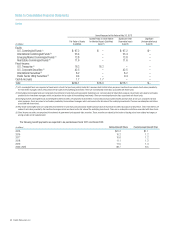
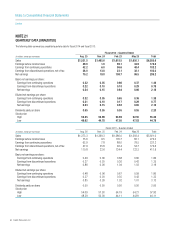
The fair values of the defined benefit pension plans assets at their measurement dates of May 25, 2014 and May 26, 2013, are as follows:
Items Measured at Fair Value at May 25, 2014
Quoted Prices in Active Market Significant Other Significant
Fair Value of Assets for Identical Assets (Liabilities) Observable Inputs Unobservable Inputs
(in millions) (Liabilities) (Level 1) (Level 2) (Level 3)
Equity:
U.S. Commingled Funds (1) $ 87.5 $ – $ 87.5 $ –
International Commingled Funds (2) 31.2 – 31.2 –
Emerging Market Commingled Funds (3) 13.3 – 13.3 –
Real Estate Commingled Funds (4) 10.5 – 10.5 –
Fixed-Income:
U.S. Treasuries (5) 27.6 27.6 – –
U.S. Corporate Securities (5) 48.0 – 48.0 –
International Securities (5) 10.0 – 10.0 –
Public Sector Utility Securities (5) 13.1 – 13.1 –
Cash & Accruals 2.7 2.7 – –
Total $243.9 $30.3 $213.6 $ –