Red Lobster 2014 Annual Report Download - page 11
Download and view the complete annual report
Please find page 11 of the 2014 Red Lobster annual report below. You can navigate through the pages in the report by either clicking on the pages listed below, or by using the keyword search tool below to find specific information within the annual report.-
 1
1 -
 2
2 -
 3
3 -
 4
4 -
 5
5 -
 6
6 -
 7
7 -
 8
8 -
 9
9 -
 10
10 -
 11
11 -
 12
12 -
 13
13 -
 14
14 -
 15
15 -
 16
16 -
 17
17 -
 18
18 -
 19
19 -
 20
20 -
 21
21 -
 22
22 -
23
-
24
-
25
-
26
-
27
-
28
-
29
-
30
-
31
-
32
-
33
-
34
-
35
-
36
-
37
-
38
-
39
-
40
-
41
-
42
-
43
-
44
-
45
-
46
-
47
-
48
-
49
-
50
-
51
-
52
-
53
-
54
-
55
-
56
-
57
-
58
-
59
-
60
 |
 |

Management’s Discussion and Analysis
of Financial Condition and Results of Operations
Darden
2014 Annual Report 9
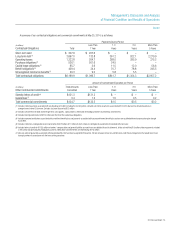
Selling, general and administrative expenses increased $38.1 million,
or 6.1 percent, from $625.4 million in fiscal 2013 to $663.5 million in fiscal
2014. Selling, general and administrative expenses increased $85.3 million,
or 15.8 percent, from $540.1 million in fiscal 2012 to $625.4 million in fiscal
2013. As a percent of sales, selling, general and administrative expenses
increased from fiscal 2013 to fiscal 2014 primarily as a result of the costs
related to implementation of the strategic action plan and workforce reductions
mentioned above, partially offset by sales leverage. As a percent of sales,
selling, general and administrative expenses increased from fiscal 2012
to fiscal 2013 primarily due to higher media costs and acquisition and
integration costs associated with the Yard House acquisition, partially offset
by sales leverage.
Depreciation and amortization expense increased $26.1 million, or
9.4 percent, from $278.3 million in fiscal 2013 to $304.4 million in fiscal
2014. Depreciation and amortization expense increased $37.0 million, or
15.3 percent, from $241.3 million in fiscal 2012 to $278.3 million in fiscal
2013. As a percent of sales, depreciation and amortization expense increased
in fiscal 2014 and fiscal 2013 primarily due to an increase in depreciable
assets related to new restaurants and remodel activities.
Net interest expense increased $8.3 million, or 6.6 percent, from
$126.0 million in fiscal 2013 to $134.3 million in fiscal 2014. Net interest
expense increased $23.9 million, or 23.4 percent, from $102.1 million in
fiscal 2012 to $126.0 million in fiscal 2013. As a percent of sales, net interest
expense was flat in fiscal 2014 compared to fiscal 2013. As a percent of
sales, net interest expense increased in fiscal 2013 compared to fiscal 2012
due to higher average debt balances in fiscal 2013, principally driven by the
acquisition of Yard House.
INCOME TAXES
The effective income tax rates for fiscal 2014, 2013 and 2012 for continuing
operations were (4.9) percent, 13.4 percent and 21.4 percent, respectively.
The decrease in our effective rate for fiscal 2014 compared to fiscal 2013
is primarily due to an increase in the impact of certain tax credits on lower
earnings before income taxes and a favorable adjustment related to the
deduction of ESOP dividends for the current and prior years, partially offset
by the impact of market-driven changes in the value of our trust-owned life
insurance that are excluded for tax purposes. The decrease in our effective
rate for fiscal 2013 compared to fiscal 2012 is primarily attributable to an
increase in the impact of FICA tax credits for employee reported tips on lower
earnings before income taxes and the tax impact of market-driven changes
in the value of our trust-owned life insurance that are excluded for tax
purposes, partially offset by a decrease in federal income tax credits related
to the HIRE Act.
The effective income tax rates for fiscal 2014, 2013 and 2012 for
discontinued operations were 23.9 percent, 29.4 percent and 30.2 percent,
respectively. The decrease in the effective rate for fiscal 2014 compared
to fiscal 2013 and for fiscal 2013 compared to fiscal 2012 is primarily due
to an increase in the impact of certain tax credits on lower earnings before
income taxes.
NET EARNINGS AND NET EARNINGS PER SHARE
FROM CONTINUING OPERATIONS
Net earnings from continuing operations for fiscal 2014 were $183.2 million
($1.38 per diluted share) compared with net earnings from continuing
operations for fiscal 2013 of $237.3 million ($1.80 per diluted share) and
net earnings from continuing operations for fiscal 2012 of $279.2 million
($2.10 per diluted share).
Net earnings from continuing operations for fiscal 2014 decreased
22.8 percent and diluted net earnings per share from continuing operations
decreased 23.3 percent compared with fiscal 2013, primarily due to higher
food and beverage costs and restaurant expenses as a percent of sales,
partially offset by increased sales and a lower effective income tax rate. Our
diluted net earnings per share from continuing operations for fiscal 2014
were adversely impacted by approximately $0.23, comprised of approxi-
mately $0.10 due to legal, financial advisory and other costs related to
implementation of the strategic action plan announced in December 2013,
approximately $0.08 due to asset impairment charges and approximately
$0.05 due to costs associated with our September 2013 workforce reduction.
Net earnings from continuing operations for fiscal 2013 decreased
15.0 percent and diluted net earnings per share from continuing operations
decreased 14.3 percent compared with fiscal 2012 primarily due to higher
selling, general and administrative expenses, restaurant expenses, depre-
ciation and amortization expenses and net interest expense as a percent of
sales, partially offset by increased sales and a lower effective income tax rate.
Costs associated with the Yard House acquisition adversely affected diluted
net earnings per share from continuing operations by approximately $0.09.
EARNINGS FROM DISCONTINUED OPERATIONS
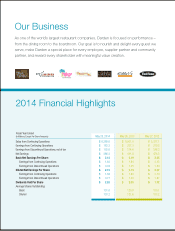
Red Lobster’s sales of $2.46 billion in fiscal 2014 were 6.2 percent below
fiscal 2013, driven primarily by a U.S. same-restaurant sales decrease of
6.0 percent, partially offset by revenue from one net new restaurant. The
decrease in U.S. same-restaurant sales resulted from a 9.3 percent decrease
in same-restaurant guest counts, partially offset by a 3.3 percent increase in
average guest check. Average annual sales per restaurant for Red Lobster
were $3.5 million in fiscal 2014 compared to $3.7 million in fiscal 2013.
Red Lobster’s sales of $2.62 billion in fiscal 2013 were 1.7 percent
below fiscal 2012, driven primarily by a U.S. same-restaurant sales decrease
of 2.2 percent partially offset by revenue from one net new restaurant. The
decrease in U.S. same-restaurant sales resulted from a 1.8 percent decrease
in same-restaurant guest counts combined with a 0.4 percent decrease in
average guest check. Average annual sales per restaurant for Red Lobster
were $3.7 million in fiscal 2013 compared to $3.8 million in fiscal 2012.
On an after-tax basis, earnings from discontinued operations for fiscal
2014 were $103.0 million ($0.77 per diluted share) compared with earnings
from discontinued operations for fiscal 2013 of $174.6 million ($1.33 per
diluted share) and fiscal 2012 of $196.3 million ($1.47 per diluted share).
The decrease in earnings from discontinued operations in fiscal 2014 and
fiscal 2013 was primarily driven by a decrease in sales and overall perfor-
mance at Red Lobster in addition to separation-related costs (approximately
$0.10 per diluted share) and impairments recorded for the two closed
synergy locations (approximately $0.04 per diluted share).
SEASONALITY
Our sales volumes fluctuate seasonally. Typically, our average sales per
restaurant are highest in the spring and winter, followed by the summer, and
lowest in the fall. Holidays, changes in the economy, severe weather and
similar conditions may impact sales volumes seasonally in some operating
regions. Because of the seasonality of our business, results for any quarter
are not necessarily indicative of the results that may be achieved for the full
fiscal year.