Red Lobster 2014 Annual Report Download - page 8
Download and view the complete annual report
Please find page 8 of the 2014 Red Lobster annual report below. You can navigate through the pages in the report by either clicking on the pages listed below, or by using the keyword search tool below to find specific information within the annual report.-
 1
1 -
 2
2 -
 3
3 -
 4
4 -
 5
5 -
 6
6 -
 7
7 -
 8
8 -
 9
9 -
 10
10 -
 11
11 -
 12
12 -
 13
13 -
 14
14 -
 15
15 -
 16
16 -
 17
17 -
 18
18 -
 19
19 -
20
-
21
-
22
-
23
-
24
-
25
-
26
-
27
-
28
-
29
-
30
-
31
-
32
-
33
-
34
-
35
-
36
-
37
-
38
-
39
-
40
-
41
-
42
-
43
-
44
-
45
-
46
-
47
-
48
-
49
-
50
-
51
-
52
-
53
-
54
-
55
-
56
-
57
-
58
-
59
-
60
 |
 |

Management’s Discussion and Analysis
of Financial Condition and Results of Operations
Darden
6 Darden Restaurants, Inc.
This discussion and analysis below for Darden Restaurants, Inc. (Darden, the
Company, we, us or our) should be read in conjunction with our consolidated
financial statements and related financial statement notes found elsewhere
in this report. We operate on a 52/53 week fiscal year, which ends on the last
Sunday in May. Fiscal 2014, 2013 and 2012 each consisted of 52 weeks
of operation.
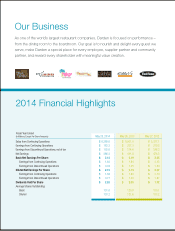
OVERVIEW OF OPERATIONS
Our business operates in the full-service dining segment of the restaurant
industry, primarily in the United States. At May 25, 2014, we operated 2,207
Olive Garden®, Red Lobster®, LongHorn Steakhouse®, The Capital Grille®,
Yard House®, Bahama Breeze®, Seasons 52®, Eddie V’s Prime Seafood® and
Wildfish Seafood Grille® restaurants in the United States and Canada. Through
subsidiaries, we own and operate all of our restaurants in the United States
and Canada, except for three restaurants located in Central Florida and three
restaurants in California that are owned jointly by us and third parties, and
managed by us, one franchised restaurant in Atlanta and seven franchised
restaurants in Puerto Rico. We also have area development and franchise
agreements with unaffiliated operators to develop and operate our brands in
Asia, the Middle East and Latin America. Pursuant to these agreements, as
of May 25, 2014, 45 franchised restaurants were in operation in Japan, the
Middle East, Mexico, Brazil and Peru. All significant inter-company balances
and transactions have been eliminated in consolidation.
On May 15, 2014, we entered into an agreement to sell Red Lobster
and certain related assets and associated liabilities for $2.11 billion in cash
and we expect the transaction to close during the first quarter of fiscal 2015.
These assets and liabilities are classified as held for sale on our consolidated
balance sheet as of May 25, 2014. Additionally, in the fourth quarter of fiscal
2014, in connection with the sale of Red Lobster, we closed two restaurants
that housed both a Red Lobster and an Olive Garden in the same building
(synergy restaurants). We have classified the results of operations and
impairment charges of the Red Lobster business and the two closed synergy
restaurants as discontinued operations in our consolidated statements of
earnings and cash flows for all periods presented. No amounts for shared
general and administrative operating support expense or interest expense
were allocated to discontinued operations.
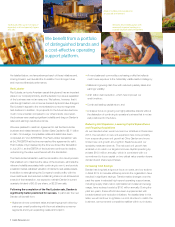
Our mission is to be the best in full-service dining, now and for
generations. We believe we can achieve this goal by continuing to build on
our strategy to be a multi-brand restaurant growth company, which is
grounded in:
• Brand relevance;
• Brand support;
• A vibrant business model;
• Competitively superior leadership; and
• A unifying, motivating culture.
Further, we believe the sale of Red Lobster will allow us to enhance our
focus on our mission with respect to our remaining brands.
We seek to increase profits by leveraging our fixed and semi-fixed
costs with sales from new restaurants and increased guest traffic and sales
at existing restaurants. To evaluate our operations and assess our financial
performance, we monitor a number of operating measures, with a special
focus on two key factors:
• Same-restaurant sales – which is a year-over-year comparison of
each period’s sales volumes for restaurants open at least 16 months,
including recently acquired restaurants, regardless of when the
restaurants were acquired; and
• Restaurant earnings – which is restaurant-level profitability (restaurant
sales, less restaurant-level cost of sales, marketing and depreciation).
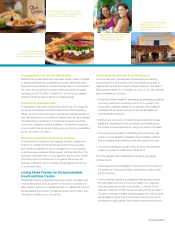
Increasing same-restaurant sales can improve restaurant earnings
because these incremental sales provide better leverage of our fixed and
semi-fixed restaurant-level costs. A restaurant brand can generate same-
restaurant sales increases through increases in guest traffic, increases in the
average guest check, or a combination of the two. The average guest check
can be impacted by menu price changes and by the mix of menu items sold.
For each restaurant brand, we gather daily sales data and regularly analyze
the guest traffic counts and the mix of menu items sold to aid in developing
menu pricing, product offerings and promotional strategies. We focus on
balancing our pricing and product offerings with other initiatives to produce
sustainable same-restaurant sales growth.
We compute same-restaurant sales using restaurants open at least
16 months because this period is generally required for new restaurant sales
levels to normalize. Sales at newly opened restaurants generally do not make
a significant contribution to profitability in their initial months of operation
due to operating inefficiencies. Our sales and expenses can be impacted
significantly by the number and timing of new restaurant openings and closings,
relocations and remodeling of existing restaurants. Pre-opening expenses
each period reflect the costs associated with opening new restaurants in
current and future periods.
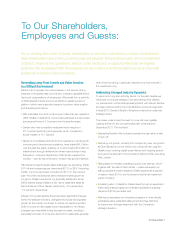
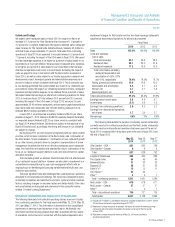
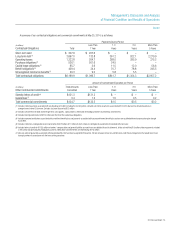
Fiscal 2014 Financial Highlights
Our sales from continuing operations were $6.29 billion in fiscal 2014
compared to $5.92 billion in fiscal 2013. The 6.2 percent increase in sales
from continuing operations was primarily driven by the addition of 70 net
new company-owned restaurants, a 1.6 percent blended same-restaurant
sales increase for The Capital Grille, Bahama Breeze, Seasons 52, Eddie V’s
and Yard House, and a 2.7 percent same-restaurant sales increase for
LongHorn Steakhouse, partially offset by a 3.4 percent same-restaurant
sales decrease for Olive Garden.
Net earnings from continuing operations for fiscal 2014 were
$183.2 million ($1.38 per diluted share) compared with net earnings from
continuing operations for fiscal 2013 of $237.3 million ($1.80 per diluted
share). Net earnings from continuing operations for fiscal 2014 decreased
22.8 percent and diluted net earnings per share from continuing operations
decreased 23.3 percent compared with fiscal 2013.
Our net earnings from discontinued operations were $103.0 million
($0.77 per diluted share) for fiscal 2014, compared with net earnings from
discontinued operations of $174.6 million ($1.33 per diluted share) for
fiscal 2013. When combined with results from continuing operations, our
diluted net earnings per share were $2.15 and $3.13 for fiscal 2014 and
2013, respectively.
During the second quarter of fiscal 2014, a comprehensive review of
operations resulted in a strategic action plan with three primary components.
The first was a decision to reduce operating support costs through a combi-
nation of workforce reductions and program spending cuts which primarily
impacted our selling, general and administrative expenses. The second
was the announcement in December 2013, to separate the Red Lobster
business. The third was a commitment to slow down new unit growth.