Red Lobster 2014 Annual Report Download - page 10
Download and view the complete annual report
Please find page 10 of the 2014 Red Lobster annual report below. You can navigate through the pages in the report by either clicking on the pages listed below, or by using the keyword search tool below to find specific information within the annual report.-
 1
1 -
 2
2 -
 3
3 -
 4
4 -
 5
5 -
 6
6 -
 7
7 -
 8
8 -
 9
9 -
 10
10 -
 11
11 -
 12
12 -
 13
13 -
 14
14 -
 15
15 -
 16
16 -
 17
17 -
 18
18 -
 19
19 -
 20
20 -
 21
21 -
22
-
23
-
24
-
25
-
26
-
27
-
28
-
29
-
30
-
31
-
32
-
33
-
34
-
35
-
36
-
37
-
38
-
39
-
40
-
41
-
42
-
43
-
44
-
45
-
46
-
47
-
48
-
49
-
50
-
51
-
52
-
53
-
54
-
55
-
56
-
57
-
58
-
59
-
60
 |
 |

Management’s Discussion and Analysis
of Financial Condition and Results of Operations
Darden
8 Darden Restaurants, Inc.
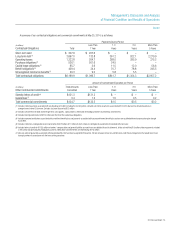
SALES
Sales from continuing operations were $6.29 billion in fiscal 2014,
$5.92 billion in fiscal 2013 and $5.33 billion in fiscal 2012. The 6.2 percent
increase in sales from continuing operations for fiscal 2014 was driven by
the addition of 70 net new company-owned restaurants, a 1.6 percent
blended same-restaurant sales increase for The Capital Grille, Bahama Breeze,
Seasons 52, Eddie V’s and Yard House, and a 2.7 percent same-restaurant
sales increase for LongHorn Steakhouse, partially offset by a 3.4 percent
same-restaurant sales decrease for Olive Garden.
Olive Garden’s sales of $3.64 billion in fiscal 2014 were 1.1 percent
below fiscal 2013, driven primarily by a U.S. same-restaurant sales decrease
of 3.4 percent partially offset by revenue from nine net new restaurants. The
decrease in U.S. same-restaurant sales resulted from a 4.2 percent decrease
in same-restaurant guest counts partially offset by a 0.8 percent increase in
average check. Average annual sales per restaurant for Olive Garden were
$4.4 million in fiscal 2014 compared to $4.6 million in fiscal 2013.
LongHorn Steakhouse’s sales of $1.38 billion in fiscal 2014 were
12.4 percent above fiscal 2013, driven primarily by revenue from 34 net new
restaurants combined with a same-restaurant sales increase of 2.7 percent.
The increase in same-restaurant sales resulted from a 0.3 percent increase
in same-restaurant guest counts combined with a 2.4 percent increase in
average guest check. Average annual sales per restaurant for LongHorn
Steakhouse were $3.1 million in fiscal 2014 compared to $3.0 million in
fiscal 2013.
In total, The Capital Grille, Bahama Breeze, Seasons 52, Eddie V’s
and Yard House generated sales of $1.23 billion in fiscal 2014, which were
25.2 percent above fiscal 2013, primarily driven by the incremental sales
from 27 net new restaurants since the end of fiscal 2013 in addition to the
40 Yard House restaurants acquired in the second quarter of fiscal 2013.
Sales growth also reflected same-restaurant sales increases of 3.4 percent
at The Capital Grille, 4.1 percent at Bahama Breeze, 1.1 percent at Eddie V’s
and 0.3 percent at Yard House, and a same-restaurant sales decrease of
2.2 percent at Seasons 52. Average annual sales per restaurant for
The Capital Grille were $7.1 million in fiscal 2014 compared to $7.0 million
in fiscal 2013. Average annual sales per restaurant for Bahama Breeze were
$5.6 million in fiscal 2014 compared to $5.5 million in fiscal 2013. Average
annual sales per restaurant for Seasons 52 were $5.7 million in fiscal 2014
compared to $6.2 million in fiscal 2013. Average annual sales per restaurant
for Eddie V’s were $6.0 million in fiscal 2014 compared to $5.8 million in
fiscal 2013. Average annual sales per restaurant for Yard House were
$8.2 million in fiscal 2014 and fiscal 2013.
The 11.1 percent increase in sales from continuing operations for fiscal
2013 was driven by the addition of 102 net new company-owned restaurants
plus the addition of 40 Yard House purchased restaurants, a 2.1 percent
blended same-restaurant sales increase for The Capital Grille, Bahama
Breeze and Seasons 52, and a 1.2 percent same-restaurant sales increase
for LongHorn Steakhouse partially offset by a 1.5 percent same-restaurant
sales decrease for Olive Garden.
Olive Garden’s sales of $3.68 billion in fiscal 2013 were 2.9 percent
above fiscal 2012, driven primarily by revenue from 36 net new restaurants
partially offset by a U.S. same-restaurant sales decrease of 1.5 percent. The
decrease in U.S. same-restaurant sales resulted from a 2.8 percent decrease
in same-restaurant guest counts partially offset by a 1.3 percent increase in
average check. Average annual sales per restaurant for Olive Garden were
$4.6 million in fiscal 2013 compared to $4.7 million in fiscal 2012.
LongHorn Steakhouse’s sales of $1.23 billion in fiscal 2013 were
10.3 percent above fiscal 2012, driven primarily by revenue from 44 net new
restaurants combined with a same-restaurant sales increase of 1.2 percent.
The increase in same-restaurant sales resulted from a 1.1 percent increase
in same-restaurant guest counts combined with a 0.1 percent increase in
average guest check. Average annual sales per restaurant for LongHorn
Steakhouse were $3.0 million in fiscal 2013 and fiscal 2012.
In total, The Capital Grille, Bahama Breeze, Seasons 52, Eddie V’s and
Yard House generated sales of $986.4 million in fiscal 2013, which were
58.3 percent above fiscal 2012, primarily driven by the Yard House acquisi-
tion. Additionally, Seasons 52 added eight new restaurants, Yard House
added four new restaurants, The Capital Grille added three new restaurants,
Bahama Breeze added three new restaurants, and Eddie V’s added one new
restaurant. Sales growth also reflected same-restaurant sales increases of
3.3 percent at The Capital Grille, 1.2 percent at Seasons 52 and 0.2 percent
at Bahama Breeze. Average annual sales per restaurant for The Capital Grille
were $7.0 million in fiscal 2013 compared to $6.8 million in fiscal 2012.
Average annual sales per restaurant for Bahama Breeze were $5.5 million in
fiscal 2013 compared to $5.6 million in fiscal 2012. Average annual sales
per restaurant for Seasons 52 were $6.2 million in fiscal 2013 compared to
$6.4 million in fiscal 2012. Average annual sales per restaurant for Eddie V’s
were $5.8 million in fiscal 2013 compared to $5.9 million in fiscal 2012.
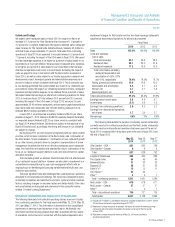
COSTS AND EXPENSES
Total costs and expenses from continuing operations were $6.11 billion in
fiscal 2014, $5.65 billion in fiscal 2013 and $4.97 billion in fiscal 2012. As
a percent of sales, total costs and expenses from continuing operations were
97.2 percent in fiscal 2014, 95.4 percent in fiscal 2013 and 93.3 percent
in fiscal 2012.
Food and beverage costs increased $148.6 million, or 8.5 percent,
from $1.74 billion in fiscal 2013 to $1.89 billion in fiscal 2014. Food and
beverage costs increased $189.9 million, or 12.2 percent, from $1.55 billion
in fiscal 2012 to $1.74 billion in fiscal 2013. As a percent of sales, food and
beverage costs increased from fiscal 2013 to fiscal 2014 primarily as a
result of food cost inflation partially offset by pricing. As a percent of sales,
food and beverage costs increased from fiscal 2012 to fiscal 2013 primarily
as a result of food cost inflation and unfavorable menu-mix, partially offset
by pricing.
Restaurant labor costs increased $125.0 million, or 6.6 percent, from
$1.89 billion in fiscal 2013 to $2.02 billion in fiscal 2014. Restaurant labor
costs increased $209.0 million, or 12.4 percent, from $1.68 billion in fiscal
2012 to $1.89 billion in fiscal 2013. As a percent of sales, restaurant labor
costs increased in fiscal 2014 primarily as a result of wage-rate inflation and
decreased labor efficiency, partially offset by sales leverage. As a percent
of sales, restaurant labor costs increased in fiscal 2013 primarily as a result
of decreased labor efficiency and wage-rate inflation.
Restaurant expenses (which include utilities, repairs and maintenance,
credit card, lease, property tax, workers’ compensation, new restaurant
pre-opening and other restaurant-level operating expenses) increased
$100.3 million, or 10.2 percent, from $980.4 million in fiscal 2013 to
$1.08 billion in fiscal 2014. Restaurant expenses increased $129.4 million,
or 15.2 percent, from $851.0 million in fiscal 2012 to $980.4 million in
fiscal 2013. As a percent of sales, restaurant expenses increased in fiscal
2014 as compared to fiscal 2013 due to an increase in rent expense and
higher repairs and maintenance expenses. As a percent of sales, restaurant
expenses increased in fiscal 2013 as compared to fiscal 2012 primarily as a
result of Yard House’s higher restaurant expenses as a percentage of sales
compared to our consolidated average prior to the acquisition. Additionally,
restaurant expenses as a percentage of sales increased due to lost sales
leverage, partially offset by lower utilities expenses.