Red Lobster 2014 Annual Report Download
Download and view the complete annual report
Please find the complete 2014 Red Lobster annual report below. You can navigate through the pages in the report by either clicking on the pages listed below, or by using the keyword search tool below to find specific information within the annual report.-
 1
1 -
 2
2 -
 3
3 -
 4
4 -
 5
5 -
 6
6 -
 7
7 -
 8
8 -
 9
9 -
 10
10 -
 11
11 -
 12
12 -
13
-
14
-
15
-
16
-
17
-
18
-
19
-
20
-
21
-
22
-
23
-
24
-
25
-
26
-
27
-
28
-
29
-
30
-
31
-
32
-
33
-
34
-
35
-
36
-
37
-
38
-
39
-
40
-
41
-
42
-
43
-
44
-
45
-
46
-
47
-
48
-
49
-
50
-
51
-
52
-
53
-
54
-
55
-
56
-
57
-
58
-
59
-
60
 |
 |

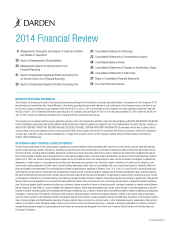
2014 Annual Report
Darden Restaurants, Inc. 2014 Annual Report
Table of contents
-
Page 1
2014 Annual Report -
Page 2
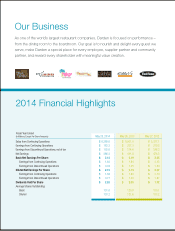
...- from the dining room to the boardroom. Our goal is to nourish and delight every guest we serve, make Darden a special place for every employee, supplier partner and community partner, and reward every shareholder with meaningful value creation. ® 2014 Financial Highlights Fiscal Year Ended (In... -
Page 3
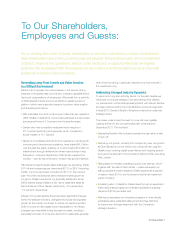
... steps to increase operating support cost savings, which - together with the sale of Red Lobster - means we expect our selling, general and administrative (SG&A) expense as a percent of sales in ï¬scal 2015 to be the lowest since Darden became a public company; • Increasing return of capital to... -
Page 4
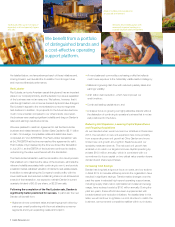
...the Red Lobster business and related assets to Golden Gate Capital for $2.11 billion in cash. On average, comparable restaurant deals have been completed at 7.9x LTM EBITDA. The Red Lobster transaction was at 9x LTM EBITDA at the time we reached the agreement to sell it. That multiple only increased... -
Page 5
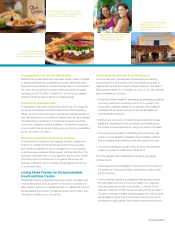
... brand-building rather than price points; and • Launching a reimaging program that includes a new logo and a plan to remodel 75 restaurants in ï¬scal 2015. The Olive Garden brand renaissance is beginning to deliver positive results. • Guest experience and satisfaction scores are improving... -
Page 6
... America to help us identify additional cost reduction and revenue enhancement opportunities. Based on actions taken to date and expected improvement in business performance, we expect SG&A as a percentage of sales to decline within 12 to 18 months of the closing of the Red Lobster sale. Optimizing... -
Page 7
..., failure to drive sales growth, our plans to expand our smaller brands Bahama Breeze, Seasons 52 and Eddie V's, a lack of suitable new restaurant locations, higher-than-anticipated costs to open, close, relocate or remodel restaurants, a failure to execute innovative marketing tactics and increased... -
Page 8
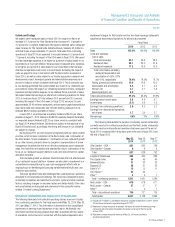
...-opening expenses each period reflect the costs associated with opening new restaurants in current and future periods. Fiscal 2014 Financial Highlights Our sales from continuing operations were $6.29 billion in fiscal 2014 compared to $5.92 billion in fiscal 2013. The 6.2 percent increase in sales... -
Page 9
... the Red Lobster restaurants currently reported in discontinued operations that were open at the end of fiscal 2014, compared with the number open at the end of fiscal 2013 and the end of fiscal 2012. May 25, 2014 Olive Garden - USA Olive Garden - Canada Total LongHorn Steakhouse The Capital Grille... -
Page 10
... sales, food and beverage costs increased from fiscal 2012 to fiscal 2013 primarily as a result of food cost inflation and unfavorable menu-mix, partially offset by pricing. Restaurant labor costs increased $125.0 million, or 6.6 percent, from $1.89 billion in fiscal 2013 to $2.02 billion in fiscal... -
Page 11
... income tax rate. Costs associated with the Yard House acquisition adversely affected diluted net earnings per share from continuing operations by approximately $0.09. EARNINGS FROM DISCONTINUED OPERATIONS Red Lobster's sales of $2.46 billion in fiscal 2014 were 6.2 percent below fiscal 2013... -
Page 12
... of Financial Condition and Results of Operations Darden IMPACT OF INFLATION We attempt to minimize the annual effects of inflation through appropriate planning, operating practices and menu price increases. We experienced higher than normal inflationary costs during fiscal 2014 and fiscal 2012 and... -
Page 13
...is discounted using a weighted-average cost of capital that reflects current market conditions. The projection uses management's best estimates of economic and market conditions over the projected period including growth rates in sales, costs and number of units, estimates of future expected changes... -
Page 14
... of our redemption period and our breakage rate periodically and apply that rate to gift card redemptions. Changing our breakage-rate assumption on unredeemed gift cards by 25 basis points would result in an adjustment in our unearned revenues of approximately $15.0 million. Income Taxes We estimate... -
Page 15
... the best available information at the time that we prepare the provision. We generally file our annual income tax returns several months after our fiscal year end. For U.S. federal income tax purposes, we participate in the Internal Revenue Service's (IRS) Compliance Assurance Process (CAP) whereby... -
Page 16
... 7.125 percent debentures due 2016. Our ability to retire the long-term debt is dependent upon the acceptance of our tender offer, in addition to the closing of the Red Lobster sale. From time to time, we enter into interest rate derivative instruments to manage interest rate risk inherent in our... -
Page 17
...expected contributions associated with our defined benefit plans and payments associated with our postretirement benefit plan and our non-qualified deferred compensation plan through fiscal 2024. (5) Includes interest on unrecognized income tax benefits of $3.2 million, $2.7 million of which relates... -
Page 18
...share in fiscal 2012, to $2.00 per share in fiscal 2013 and to $2.20 per share in fiscal 2014. In June 2014, our Board of Directors approved a quarterly dividend of $0.55 per share payable on August 1, 2014, which indicates an annual dividend of $2.20 per share in fiscal 2015. 16 Darden Restaurants... -
Page 19
... fund allocation. The expected long-term rate of return on plan assets component of our net periodic benefit cost is calculated based on the market-related value of plan assets. Currently, our target asset fund allocation is 37.0 percent U.S. equities, 40.0 percent high-quality, long-duration fixed... -
Page 20
... the impact of interest rate changes on earnings and cash flows by targeting an appropriate mix of variable and fixed rate debt. APPLICATION OF NEW ACCOUNTING STANDARDS In May 2014, the FASB issued Accounting Standards Update (ASU) 2014-09, Revenue from Contracts with Customers (Topic 606). This... -
Page 21
... a decline in the quality of the locations of our current restaurants; • Higher-than-anticipated costs to open, close, relocate or remodel restaurants; • A failure to identify and execute innovative marketing and customer relationship tactics, ineffective or improper use of social media or other... -
Page 22
... because of changes in conditions, or that the degree of compliance with the policies or procedures may deteriorate. Management assessed the effectiveness of the Company's internal control over financial reporting as of May 25, 2014. In making this assessment, management used the criteria set forth... -
Page 23
... with the standards of the Public Company Accounting Oversight Board (United States), the consolidated balance sheets of Darden Restaurants, Inc. and subsidiaries as of May 25, 2014 and May 26, 2013, and the related consolidated statements of earnings, comprehensive income, changes in stockholders... -
Page 24
...the three-year period ended May 25, 2014, in conformity with U.S. generally accepted accounting principles. We also have audited, in accordance with the standards of the Public Company Accounting Oversight Board (United States), Darden Restaurants, Inc.'s internal control over financial reporting as... -
Page 25
Consolidated Statements of Earnings Darden (in millions, except per share data) May 25, 2014 Fiscal Year Ended May 26, 2013 May 27, 2012 Sales Costs and expenses: Cost of sales: Food and beverage Restaurant labor Restaurant expenses Total cost of sales, excluding restaurant depreciation and ... -
Page 26
...held for sale Total current assets Land, buildings and equipment, net Goodwill Trademarks Other assets Total assets Liabilities and Stockholders' Equity Current liabilities: Accounts payable Short-term debt Accrued payroll Accrued income taxes Other accrued taxes Unearned revenues Current portion of... -
Page 27
... Plan and other plans (0.2 shares) Treasury shares retirement (159.3 shares) Balances at May 26, 2013 Net earnings Other comprehensive income Dividends declared ($2.20 per share) Stock option exercises (1.8 shares) Stock-based compensation ESOP note receivable repayments Income tax benefits credited... -
Page 28
... and other current assets Accounts payable Accrued payroll Prepaid/accrued income taxes Other accrued taxes Unearned revenues Other current liabilities Change in current assets and liabilities Supplemental schedule of noncash investing activities: Increase in land, buildings and equipment through... -
Page 29
... as held for sale on our consolidated balance sheet as of May 25, 2014. Additionally, in the fourth quarter of fiscal 2014, in connection with the sale of Red Lobster, we closed two restaurants that housed both a Red Lobster and an Olive Garden in the same building (synergy restaurants). We have... -
Page 30
... Year 2013 $ 1.8 (1.2) 2012 $ 1.8 (0.5) Restaurant expense - below-market leases Restaurant expense - above-market leases Amortization of capitalized software and other definite-lived intangible assets will be approximately $9.9 million annually for fiscal 2015 through 2019. 28 Darden Restaurants... -
Page 31
...is discounted using a weighted-average cost of capital that reflects current market conditions. The projection uses management's best estimates of economic and market conditions over the projected period including growth rates in sales, costs and number of units, estimates of future expected changes... -
Page 32
... costs to settle all claims, both reported and not yet reported. REVENUE RECOGNITION Sales, as presented in our consolidated statements of earnings, represents food and beverage product sold and is presented net of discounts, coupons, employee meals, and complimentary meals. Revenue from restaurant... -
Page 33
... agreements are generally for a period of one year or more and payments received are initially recorded as long-term liabilities. Amounts expected to be earned within one year are recorded as current liabilities. INCOME TAXES We provide for federal and state income taxes currently payable as well... -
Page 34
...: Fiscal Year 2014 $241.1 (in millions) 2014 $252.3 2012 $215.6 Advertising expense STOCK-BASED COMPENSATION We recognize the cost of employee service received in exchange for awards of equity instruments based on the grant date fair value of those awards. We utilize the Black-Scholes option... -
Page 35
... in fiscal 2014, 2013 and 2012, respectively, and were recorded in selling, general and administrative expenses in our consolidated statements of earnings. (in millions) May 25, 2014 4.2 Anti-dilutive restricted stock and options APPLICATION OF NEW ACCOUNTING STANDARDS COMPREHENSIVE INCOME... -
Page 36
... an agreement to sell Red Lobster and certain related assets and associated liabilities for $2.11 billion in cash and we expect the transaction to close during the first quarter of fiscal 2015. These assets and liabilities are classified as held for sale on our consolidated balance sheet as of May... -
Page 37
... 2014 Plan $5.0 0.2 $5.2 Payments $(4.9) (0.5) $(5.4) Adjustments $(0.3) (0.2) $(0.5) Balance at May 25, 2014 $8.2 0.4 $8.6 Employee termination benefits (1) Other Total (1) Excludes costs associated with stock options and restricted stock that will be settled in shares upon vesting. We expect... -
Page 38
...53.4 $457.4 May 26, 2013 $224.3 74.3 40.8 44.7 2.2 17.7 46.3 $450.3 Non-qualified deferred compensation plan Sales and other taxes Insurance-related Employee benefits Derivative liabilities Accrued interest Miscellaneous Total other current liabilities NOTE 9 LONG-TERM DEBT The components of long... -
Page 39
... HEDGING ACTIVITIES We use financial and commodities derivatives to manage interest rate, equity-based compensation and commodities pricing and foreign currency exchange rate risks inherent in our business operations. By using these instruments, we expose ourselves, from time to time, to credit risk... -
Page 40
... are as follows: Balance Sheet Location (1) (1) (1) (1) Derivative Assets Derivative Liabilities (in millions) May 25, 2014 May 26, 2013 May 25, 2014 May 26, 2013 Derivative contracts designated as hedging instruments Commodity contracts Equity forwards Interest rate related Foreign currency... -
Page 41
... Item in Fair Value Hedge Relationship Amount of Gain (Loss) Recognized in Earnings on Related Hedged Item Location of Gain (Loss) Recognized in Earnings on Related Hedged Item (in millions) Fiscal Year 2014 2013 2012 2014 Fiscal Year 2013 2012 Interest rate $(0.3) $(1.3) $(0.4) Interest, net... -
Page 42
...sale securities are as follows: Cost $ 4.5 8.4 5.4 $18.3 Market Value $ 4.5 8.5 5.4 $18.4 (in millions) Less than 1 year 1 to 3 years 3 to 5 years Total The total shares and related cost of our common stock we repurchased was as follows: Fiscal Year (in millions) 2014 2013 2012 Shares Cost Shares... -
Page 43
... Gains (Losses) on Derivatives Benefit Plan Accumulated Other Funding Position Comprehensive Income (Loss) Balances at May 27, 2012 Gain (loss) Reclassification realized in net earnings Balances at May 26, 2013 Gain (loss) Reclassification realized in net earnings Balances at May 25, 2014... -
Page 44
... and $30.3 million for fiscal 2014, 2013 and 2012, respectively. The annual future lease commitments under capital lease obligations and noncancelable operating leases, including those related to restaurants reported as discontinued operations, for each of the five fiscal years subsequent to May 25... -
Page 45
... the payment of interest associated with unrecognized tax benefits. For U.S. federal income tax purposes, we participate in the Internal Revenue Service's (IRS) Compliance Assurance Process (CAP) whereby our U.S. federal income tax returns are reviewed by the IRS both prior to and after their filing... -
Page 46
... health care benefits to our salaried retirees. Fundings related to the defined benefit pension plans and postretirement benefit plans, which are funded on a pay-as-you-go basis, were as follows: 2014 $0.4 0.9 Fiscal Year 2013 $2.4 0.8 2012 $22.2 0.5 (in millions) Defined benefit pension plans... -
Page 47
... 25 and May 26 (1) Discount rate Rate of future compensation increases Weighted-average assumptions used to determine net expense for fiscal years ended May 25 and May 26 (2) Discount rate Expected long-term rate of return on plan assets Rate of future compensation increases (1) Determined as of the... -
Page 48
... defined benefit pension plans. A quarter percentage point change in the defined benefit plans' discount rate and the expected long-term rate of return on plan assets would increase or decrease earnings before income taxes by $0.6 million and $0.5 million, respectively. The assumed health care cost... -
Page 49
...Defined Benefit Plans 2013 2012 2014 Postretirement Benefit Plan 2013 2012 (in millions) Service cost Interest cost Expected return on plan assets Amortization of unrecognized prior service cost Recognized net actuarial loss Curt ailment gain recognized Net pension and postretirement cost (benefit... -
Page 50
... and corporate debt securities. These securities are valued by the trustee at closing prices from national exchanges or pricing vendors on the valuation date. The following benefit payments are expected to be paid between fiscal 2015 and fiscal 2025: (in millions) Defined Benefit Plans $21... -
Page 51
... in weighted-average common shares outstanding for purposes of calculating net earnings per share with the exception of those shares acquired under the Additional Loan which are accounted for in accordance with FASB ASC Subtopic 718-40, Employee Stock Ownership Plans. Fluctuations in our stock price... -
Page 52
... Option and Long-Term Incentive Plan of 1995 (1995 Plan) and the Restaurant Management and Employee Stock Plan of 2000 (2000 Plan). All of the plans are administered by the Compensation Committee of the Board of Directors. The 2002 Plan provides for the issuance of up to 25.1 million common shares... -
Page 53
... of unrecognized compensation cost related to Darden stock units granted under our incentive plans. This cost is expected to be recognized over a weighted-average period of 2.9 years. The total fair value of Darden stock units that vested during fiscal 2014 was $22.7 million. 2014 Annual Report 51 -
Page 54
... fair market value of our common stock on either the first or last trading day of each calendar quarter, whichever is lower. Cash received from employees pursuant to the plan during fiscal 2014, 2013 and 2012 was $7.2 million, $7.3 million and $7.2 million, respectively. 52 Darden Restaurants, Inc... -
Page 55
... was filed in the United States District Court for the Southern District of Florida, Alequin v. Darden Restaurants, Inc., in which named plaintiffs claim that the Company required or allowed certain employees at Olive Garden, Red Lobster, LongHorn Steakhouse, Bahama Breeze and Seasons 52 to work off... -
Page 56
... Statements Darden NOTE 21 QUARTERLY DATA (UNAUDITED) The following table summarizes unaudited quarterly data for fiscal 2014 and fiscal 2013: Fiscal 2014 - Quarters Ended Feb. 23 May 25 (in millions, except per share data) Aug. 25 Nov. 24 Total Sales Earnings before income taxes Earnings from... -
Page 57
... Summary Darden (Dollars in millions, except per share data) May 25, 2014 May 26, 2013 Fiscal Year Ended May 27, 2012 May 29, 2011 May 30, 2010 Operating Results (1) Sales Costs and expenses: Cost of sales: Food and beverage Restaurant labor Restaurant expenses Total cost of sales, excluding... -
Page 58
...contact the Investor Relations Department at (407) 245-4000. Shareholders may request to receive, free of charge, copies of quarterly earnings releases. Information may also be obtained by visiting our website at www.darden. com. Annual reports, SEC filings, press releases and other Company news are... -
Page 59
... a global snack food company. Victoria D. Harker Chief Financial Ofï¬cer, Gannett Co., Inc., an international media and marketing solutions company. David H. Hughes Retired Chairman of the Board, Hughes Supply, Inc., a building supply company. William M. Lewis, Jr. Managing Director and Co-Chairman... -
Page 60
® 1000 Darden Center Drive | Orlando, FL 32837 | 407-245-4000 | www.darden.com