Red Lobster 2013 Annual Report Download - page 69
Download and view the complete annual report
Please find page 69 of the 2013 Red Lobster annual report below. You can navigate through the pages in the report by either clicking on the pages listed below, or by using the keyword search tool below to find specific information within the annual report.-
 1
1 -
2
-
3
-
4
-
5
-
6
-
7
-
8
-
9
-
10
-
11
-
12
-
13
-
14
-
15
-
16
-
17
-
18
-
19
-
20
-
21
-
22
-
23
-
24
-
25
-
26
-
27
-
28
-
29
-
30
-
31
-
32
-
33
-
34
-
35
-
36
-
37
-
38
-
39
-
40
-
41
-
42
-
43
-
44
-
45
-
46
-
47
-
48
-
49
-
50
-
51
-
52
-
53
-
54
-
55
-
56
-
57
-
58
-
 59
59 -
 60
60 -
 61
61 -
 62
62 -
 63
63 -
 64
64 -
 65
65 -
 66
66 -
 67
67 -
 68
68 -
 69
69 -
 70
70 -
 71
71 -
 72
72 -
 73
73 -
 74
74
 |
 |

Notes to Consolidated Financial Statements
Darden
Darden Restaurants, Inc. 2013 Annual Report 65
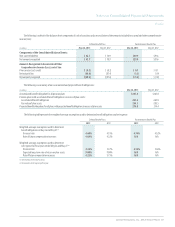
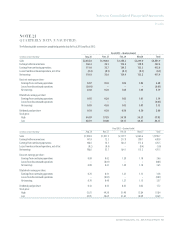
NOTE 21
QUARTERLY DATA (UNAUDITED)
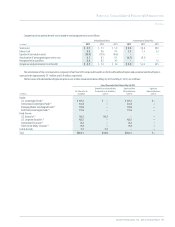
The following table summarizes unaudited quarterly data for fiscal 2013 and fiscal 2012:
Fiscal 2013 – Quarters Ended
(in millions, except per share data) Aug. 26 Nov. 25 Feb. 24 May 26 Total
Sales $2,034.8 $1,960.0 $2,258.2 $2,299.0 $8,551.9
Earnings before income taxes 146.3 43.1 173.2 159.8 522.4
Earnings from continuing operations 111.0 33.7 134.5 133.3 412.6
Losses from discontinued operations, net of tax (0.2) (0.1) (0.1) (0.1) (0.7)
Net earnings 110.8 33.6 134.4 133.2 411.9
Basic net earnings per share:
Earnings from continuing operations 0.87 0.26 1.04 1.03 3.20
Losses from discontinued operations (0.01) – – – (0.01)
Net earnings 0.86 0.26 1.04 1.03 3.19
Diluted net earnings per share:
Earnings from continuing operations 0.85 0.26 1.02 1.01 3.14
Losses from discontinued operations – – – – (0.01)
Net earnings 0.85 0.26 1.02 1.01 3.13
Dividends paid per share 0.50 0.50 0.50 0.50 2.00
Stock price:
High 54.09 57.93 54.19 54.21 57.93
Low 48.39 50.00 44.11 44.81 44.11
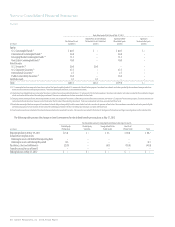
Fiscal2012–QuartersEnded
(in millions, except per share data) Aug. 28 Nov. 27 Feb. 26 May 27 Total
Sales $1,942.0 $1,831.5 $2,159.7 $2,065.6 $7,998.7
Earnings before income taxes 147.0 72.5 217.8 200.7 638.0
Earnings from continuing operations 106.8 54.1 164.1 151.6 476.5
Lossesfromdiscontinuedoperations,netoftax (0.2) (0.4) – (0.4) (1.0)
Net earnings 106.6 53.7 164.1 151.2 475.5
Basic net earnings per share:
Earnings from continuing operations 0.80 0.42 1.28 1.18 3.66
Lossesfromdiscontinuedoperations – (0.01) – – (0.01)
Net earnings 0.80 0.41 1.28 1.18 3.65
Diluted net earnings per share:
Earnings from continuing operations 0.78 0.41 1.25 1.15 3.58
Lossesfromdiscontinuedoperations – (0.01) – – (0.01)
Net earnings 0.78 0.40 1.25 1.15 3.57
Dividends paid per share 0.43 0.43 0.43 0.43 1.72
Stock price:
High 53.81 49.20 51.90 55.84 55.84
Low 43.85 40.69 41.65 48.49 40.69