Red Lobster 2013 Annual Report Download - page 41
Download and view the complete annual report
Please find page 41 of the 2013 Red Lobster annual report below. You can navigate through the pages in the report by either clicking on the pages listed below, or by using the keyword search tool below to find specific information within the annual report.-
 1
1 -
2
-
3
-
4
-
5
-
6
-
7
-
8
-
9
-
10
-
11
-
12
-
13
-
14
-
15
-
16
-
17
-
18
-
19
-
20
-
21
-
22
-
23
-
24
-
25
-
26
-
27
-
28
-
29
-
30
-
 31
31 -
 32
32 -
 33
33 -
 34
34 -
 35
35 -
 36
36 -
 37
37 -
 38
38 -
 39
39 -
 40
40 -
 41
41 -
 42
42 -
 43
43 -
 44
44 -
 45
45 -
 46
46 -
 47
47 -
 48
48 -
 49
49 -
 50
50 -
 51
51 -
52
-
53
-
54
-
55
-
56
-
57
-
58
-
59
-
60
-
61
-
62
-
63
-
64
-
65
-
66
-
67
-
68
-
69
-
70
-
71
-
72
-
73
-
74
 |
 |

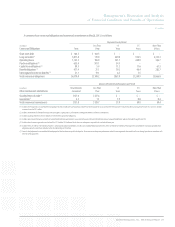
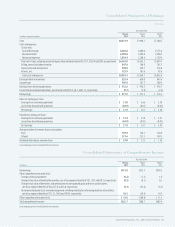
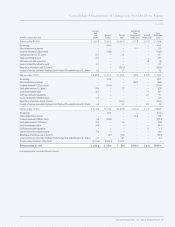
Consolidated Statements of Changes in Stockholders’ Equity
Darden
Common Accumulated
Stock Other Total
and Retained Treasury Comprehensive Unearned Stockholders’
(in millions, except per share data) Surplus Earnings Stock Income (Loss) Compensation Equity
Balances at May 30, 2010 $ 2,297.9 $ 2,621.9 $(2,943.5) $ (71.1) $(11.2) $1,894.0
Netearnings – 476.3 – – – 476.3
Othercomprehensiveincome – – – 11.3 – 11.3
Dividendsdeclared($1.28pershare) – (176.3) – – – (176.3)
Stockoptionexercises(2.3shares) 53.1 – 2.6 – – 55.7
Stock-basedcompensation 33.9 – – – – 33.9
ESOPnotereceivablerepayments – – – – 1.8 1.8
Incometaxbenefitscreditedtoequity 17.7 – – – – 17.7
Repurchasesofcommonstock(8.6shares) – – (385.5) – – (385.5)
IssuanceoftreasurystockunderEmployeeStockPurchasePlanandotherplans(0.2shares) 6.2 – 1.1 – – 7.3
Balances at May 29, 2011 $ 2,408.8 $ 2,921.9 $(3,325.3) $ (59.8) $ (9.4) $1,936.2
Netearnings – 475.5 – – – 475.5
Othercomprehensiveincome – – – (86.8) – (86.8)
Dividendsdeclared($1.72pershare) – (224.6) – – – (224.6)
Stockoptionexercises(2.2shares) 59.4 – 3.5 – – 62.9
Stock-basedcompensation 26.5 – – – – 26.5
ESOPnotereceivablerepayments – – – – 2.1 2.1
Incometaxbenefitscreditedtoequity 17.9 – – – – 17.9
Repurchasesofcommonstock(8.2shares) – – (375.1) – – (375.1)
IssuanceoftreasurystockunderEmployeeStockPurchasePlanandotherplans(0.2shares) 6.2 – 1.1 – 0.1 7.4
Balances at May 27, 2012 $ 2,518.8 $ 3,172.8 $(3,695.8) $(146.6) $ (7.2) $1,842.0
Netearnings – 411.9 – – – 411.9
Othercomprehensiveincome – – – 13.8 – 13.8
Dividendsdeclared($2.00pershare) 0.4 (259.6) – – – (259.2)
Stockoptionexercises(2.0shares) 55.2 – 1.8 – – 57.0
Stock-basedcompensation 24.3 – – – – 24.3
ESOPnotereceivablerepayments – – – – 1.1 1.1
Incometaxbenefitscreditedtoequity 13.6 – – – – 13.6
Repurchasesofcommonstock(1.0shares) – (0.1) (52.3) – – (52.4)
IssuanceoftreasurystockunderEmployeeStockPurchasePlanandotherplans(0.2shares) 6.7 – 0.7 – – 7.4
Treasurysharesretirement(159.3shares) (1,411.4) (2,326.1) 3,737.5 – – –
Balances at May 26, 2013 $ 1,207.6 $ 998.9 $ (8.1) $(132.8) $ (6.1) $2,059.5
See accompanying notes to consolidated financial statements.
Darden Restaurants, Inc. 2013 Annual Report 37