Red Lobster 2013 Annual Report Download - page 34
Download and view the complete annual report
Please find page 34 of the 2013 Red Lobster annual report below. You can navigate through the pages in the report by either clicking on the pages listed below, or by using the keyword search tool below to find specific information within the annual report.-
 1
1 -
2
-
3
-
4
-
5
-
6
-
7
-
8
-
9
-
10
-
11
-
12
-
13
-
14
-
15
-
16
-
17
-
18
-
19
-
20
-
21
-
22
-
23
-
 24
24 -
 25
25 -
 26
26 -
 27
27 -
 28
28 -
 29
29 -
 30
30 -
 31
31 -
 32
32 -
 33
33 -
 34
34 -
 35
35 -
 36
36 -
 37
37 -
 38
38 -
 39
39 -
 40
40 -
 41
41 -
 42
42 -
 43
43 -
 44
44 -
45
-
46
-
47
-
48
-
49
-
50
-
51
-
52
-
53
-
54
-
55
-
56
-
57
-
58
-
59
-
60
-
61
-
62
-
63
-
64
-
65
-
66
-
67
-
68
-
69
-
70
-
71
-
72
-
73
-
74
 |
 |

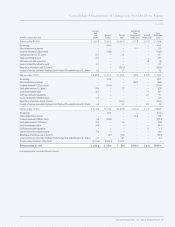
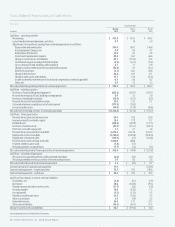
Management’s Discussion and Analysis
of Financial Condition and Results of Operations
Darden
30 Darden Restaurants, Inc. 2013 Annual Report
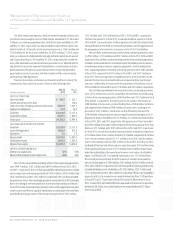
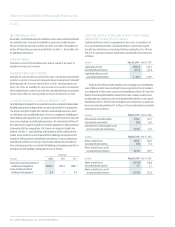
FINANCIAL CONDITION
Our total current assets were $764.9 million at May 26, 2013, compared with
$757.6 million at May 27, 2012. The increase was primarily due to an increase in
cash and cash equivalents, and an increase in deferred income taxes related to
current period activity of taxable timing differences, partially offset by lower
inventory levels related to the timing of inventory purchases.
Our total current liabilities were $1.42 billion at May 26, 2013, compared with
$1.77 billion at May 27, 2012. The decrease was primarily due to the repayment
of $350.0 million of long-term debt during fiscal 2013 which was included in
current liabilities as current portion of long-term debt at May 27, 2012 and a
decrease in short-term debt, partially offset by an increase in unearned revenues
associated with gift card sales in excess of current-period redemptions and an
increase in accounts payable.
QUANTITATIVE AND QUALITATIVE DISCLOSURES
ABOUT MARKET RISK
We are exposed to a variety of market risks, including fluctuations in interest
rates, foreign currency exchange rates, compensation and commodity prices. To
manage this exposure, we periodically enter into interest rate and foreign currency
exchange instruments, equity forwards and commodity instruments for other
than trading purposes (see Notes 1 and 10 to our consolidated financial statements,
in Part II, Item 8 of this report, incorporated herein by reference).
We use the variance/covariance method to measure value at risk, over time
horizons ranging from one week to one year, at the 95 percent confidence level.
At May 26, 2013, our potential losses in future net earnings resulting from changes
in foreign currency exchange rate instruments, commodity instruments, equity
forwards and floating rate debt interest rate exposures were approximately
$47.4 million over a period of one year (including the impact of the interest rate
swap agreements discussed in Note 10 to our consolidated financial statements
in Part II, Item 8 of this report, incorporated herein by reference). The value at
risk from an increase in the fair value of all of our long-term fixed rate debt, over
a period of one year, was approximately $160.7 million. The fair value of our long-
term debt during fiscal 2013 averaged $2.41 billion, with a high of $2.79 billion
and a low of $1.98 billion. Our interest rate risk management objective is to limit
the impact of interest rate changes on earnings and cash flows by targeting an
appropriate mix of variable and fixed rate debt.
APPLICATION OF NEW ACCOUNTING STANDARDS
In February 2013, the FASB issued Accounting Standards Update (ASU) 2013-02,
Comprehensive Income (Topic 220), Reporting Amounts Reclassified Out of
Accumulated Other Comprehensive Income. This update requires companies to
provide information about the amounts reclassified out of accumulated other
comprehensive income by component. In addition, companies are required to
present, either on the face of the statement where net income is presented or in
the notes, significant amounts reclassified out of accumulated other comprehen-
sive income by the respective line items of net income. This update is effective
for us in our first quarter of fiscal 2014 and will be applied prospectively. Other
than requiring additional disclosures, adoption of this new guidance will not
have a significant impact on our consolidated financial statements.
InJuly2012,theFASBissuedASU2012-02,Intangibles–GoodwillandOther
(Topic 350), Testing Indefinite Lived Intangible Assets for Impairment. This update
simplifies the guidance for testing the decline in the realizable value (impairment)
of indefinite-lived intangible assets other than goodwill and allows companies
the option to first assess qualitative factors to determine whether it is necessary
to perform the quantitative impairment test. Companies electing to perform a
qualitative assessment are no longer required to calculate the fair value of an
indefinite-lived intangible asset unless the company determines, based on a
qualitative assessment, that it is “more likely than not” that the asset is impaired.
This update is effective for annual and interim impairment tests performed in
fiscal years beginning after September 15, 2012, which will require us to adopt
theseprovisionsinfiscal2014;however,earlyadoptionispermitted.Wedonot
believe adoption of this new guidance will have a significant impact on our
consolidated financial statements.