Qantas 2012 Annual Report Download - page 153
Download and view the complete annual report
Please find page 153 of the 2012 Qantas annual report below. You can navigate through the pages in the report by either clicking on the pages listed below, or by using the keyword search tool below to find specific information within the annual report.-
 1
1 -
2
-
3
-
4
-
5
-
6
-
7
-
8
-
9
-
10
-
11
-
12
-
13
-
14
-
15
-
16
-
17
-
18
-
19
-
20
-
21
-
22
-
23
-
24
-
25
-
26
-
27
-
28
-
29
-
30
-
31
-
32
-
33
-
34
-
35
-
36
-
37
-
38
-
39
-
40
-
41
-
42
-
43
-
44
-
45
-
46
-
47
-
48
-
49
-
50
-
51
-
52
-
53
-
54
-
55
-
56
-
57
-
58
-
59
-
60
-
61
-
62
-
63
-
64
-
65
-
66
-
67
-
68
-
69
-
70
-
71
-
72
-
73
-
74
-
75
-
76
-
77
-
78
-
79
-
80
-
81
-
82
-
83
-
84
-
85
-
86
-
87
-
88
-
89
-
90
-
91
-
92
-
93
-
94
-
95
-
96
-
97
-
98
-
99
-
100
-
101
-
102
-
103
-
104
-
105
-
106
-
107
-
108
-
109
-
110
-
111
-
112
-
113
-
114
-
115
-
116
-
117
-
118
-
119
-
120
-
121
-
122
-
123
-
124
-
125
-
126
-
127
-
128
-
129
-
130
-
131
-
132
-
133
-
134
-
135
-
136
-
137
-
138
-
139
-
140
-
141
-
142
-
 143
143 -
 144
144 -
 145
145 -
 146
146 -
 147
147 -
 148
148 -
 149
149 -
 150
150 -
 151
151 -
 152
152 -
 153
153 -
 154
154 -
 155
155 -
 156
156
 |
 |

Sustainability Statistics and Notes continued
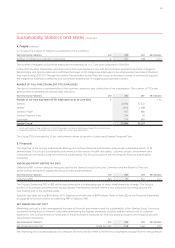
A detailed definition, methodology
and reconciliation of Underlying PBT
to Statutory PBT is contained in Note 2
to the Financial Statements on page 80
of the Financial Report.
Net Underlying Unit Cost
The Net Underlying Unit Cost of the
Group, which is the Underlying PBT less
Passenger Revenue, fuel and Frequent
Flyer change in accounting estimate,
divided by the Group’s Available Seat
Kilometres (ASKs). Net underlying
expenditure is derived from total
passenger revenue less Underlying PBT.
Free Cash Flow
Free cash flow is a measure of financial
performance calculated as operating
cash flows net of investing cash flows.
Scope:
The Consolidated Financial Statements
for the year ended 30 June 2012 comprise
Qantas and its controlled entities and the
Qantas Group’s interest in associates and
jointly controlled entities.
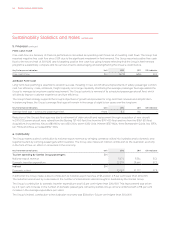
Average fleet age – scheduled
passenger fleet
The average age of the Group’s
scheduled passenger fleet based
on manufacturing dates.
Scope:
The scheduled passenger fleet of the
Qantas Group, including both owned
and leased aircraft. The Qantas Group’s
scheduled passenger fleet does not
include dedicated freighters and
Network Aviation fleet.
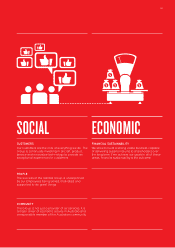
COMMUNITY
National export revenue
National export revenue is calculated
as the number of inbound visitors
brought to Australia by Qantas, Jetstar
and Jetstar Asia for the 12 months to
31 May (latest available data as at
30 June) multiplied by the estimated
average visitor expenditure of $3,313.
(Source: Tourism Australia’s March 2012
International Visitor Survey (latest available
data)) (2011: $3,315 (Source: Tourism
Australia’s March 2011 International Visitor
Survey)). This amount does not include
the value of airfare and freight charges
that accrue to the Qantas Group from
overseas sources. These also represent
export revenue.
Domestic traveller expenditure
Domestic traveller expenditure is
calculated as the number of Qantas
Group domestic passengers for the
financial year multiplied by the estimated
average expenditure per visitor of $681
(Source: Tourism Australia’s March 2012
National Visitor Survey (latest available
data)) (2011: $620 (Source: Tourism
Australia’s March 2011 National Visitor
Survey)). This amount includes the value
of related airfares. As it is not possible to
disaggregate the data, the calculation
should be viewed as indicative only, e.g.
the figure may include some international
visitor expenditure (where domestic
flights are purchased after arrival in
Australia) or understate the expenditure
associated with domestic flights which
are ‘round trip’.
Economic output
This measure is calculated as the Qantas
Group total revenue multiplied by a
Qantas Group economic multiplier of 2.1
(as calculated by Access Economics
in 2008). The multiplier is derived from
Australian Bureau of Statistics input/
output tables of the Australian economy.
Access Economics is an economic
advisory company which provides
expertise in analysis, modelling and
forecasting. Access Economics was
commissioned by Qantas to gain a better
understanding of the Group’s contribution
to the Australian economy. A multiplier
of 2.1 suggests that a $1 million increase
in demand for Qantas’ services leads
to a $2.1 million increase in output from
all sectors in the economy, including air
transportation. In other words, the flow-
on effect outside of the Qantas Group for
every $1 million of revenue is $1.1 million.
Definitions and Scopes continued
151