Qantas 2012 Annual Report Download - page 13
Download and view the complete annual report
Please find page 13 of the 2012 Qantas annual report below. You can navigate through the pages in the report by either clicking on the pages listed below, or by using the keyword search tool below to find specific information within the annual report.-
 1
1 -
2
-
 3
3 -
 4
4 -
 5
5 -
 6
6 -
 7
7 -
 8
8 -
 9
9 -
 10
10 -
 11
11 -
 12
12 -
 13
13 -
 14
14 -
 15
15 -
 16
16 -
 17
17 -
 18
18 -
 19
19 -
 20
20 -
 21
21 -
 22
22 -
 23
23 -
24
-
25
-
26
-
27
-
28
-
29
-
30
-
31
-
32
-
33
-
34
-
35
-
36
-
37
-
38
-
39
-
40
-
41
-
42
-
43
-
44
-
45
-
46
-
47
-
48
-
49
-
50
-
51
-
52
-
53
-
54
-
55
-
56
-
57
-
58
-
59
-
60
-
61
-
62
-
63
-
64
-
65
-
66
-
67
-
68
-
69
-
70
-
71
-
72
-
73
-
74
-
75
-
76
-
77
-
78
-
79
-
80
-
81
-
82
-
83
-
84
-
85
-
86
-
87
-
88
-
89
-
90
-
91
-
92
-
93
-
94
-
95
-
96
-
97
-
98
-
99
-
100
-
101
-
102
-
103
-
104
-
105
-
106
-
107
-
108
-
109
-
110
-
111
-
112
-
113
-
114
-
115
-
116
-
117
-
118
-
119
-
120
-
121
-
122
-
123
-
124
-
125
-
126
-
127
-
128
-
129
-
130
-
131
-
132
-
133
-
134
-
135
-
136
-
137
-
138
-
139
-
140
-
141
-
142
-
143
-
144
-
145
-
146
-
147
-
148
-
149
-
150
-
151
-
152
-
153
-
154
-
155
-
156
 |
 |

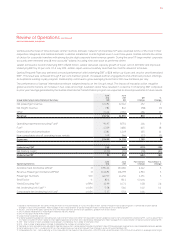
Qantas Frequent Flyer
Qantas Frequent Flyer delivered record
Normalised EBIT* of $231 million. Billings
increased by 14 per cent to $1.2 billion
and membership now stands at 8.6 million
people, averaging more than 2,000 new
members each day.
Jetstar
Jetstar reported record Underlying EBIT* of
$203 million. Revenue increased by 18 per cent
and unit costs* were reduced to record lows
as Jetstar maintained capacity and passenger
growth in all markets.
Qantas
Qantas reported an Underlying EBIT* loss
of $21 million, reflecting the poor performance
of its international network. Domestically,
Qantas performed strongly with higher
Underlying EBIT* compared with 2010/2011.
Significant progress was made in Qantas’
five-year international turnaround plan.
*For explanations of non-statutory measures see the Review of Operations.
011