Qantas 2012 Annual Report Download - page 118
Download and view the complete annual report
Please find page 118 of the 2012 Qantas annual report below. You can navigate through the pages in the report by either clicking on the pages listed below, or by using the keyword search tool below to find specific information within the annual report.-
 1
1 -
2
-
3
-
4
-
5
-
6
-
7
-
8
-
9
-
10
-
11
-
12
-
13
-
14
-
15
-
16
-
17
-
18
-
19
-
20
-
21
-
22
-
23
-
24
-
25
-
26
-
27
-
28
-
29
-
30
-
31
-
32
-
33
-
34
-
35
-
36
-
37
-
38
-
39
-
40
-
41
-
42
-
43
-
44
-
45
-
46
-
47
-
48
-
49
-
50
-
51
-
52
-
53
-
54
-
55
-
56
-
57
-
58
-
59
-
60
-
61
-
62
-
63
-
64
-
65
-
66
-
67
-
68
-
69
-
70
-
71
-
72
-
73
-
74
-
75
-
76
-
77
-
78
-
79
-
80
-
81
-
82
-
83
-
84
-
85
-
86
-
87
-
88
-
89
-
90
-
91
-
92
-
93
-
94
-
95
-
96
-
97
-
98
-
99
-
100
-
101
-
102
-
103
-
104
-
105
-
106
-
107
-
 108
108 -
 109
109 -
 110
110 -
 111
111 -
 112
112 -
 113
113 -
 114
114 -
 115
115 -
 116
116 -
 117
117 -
 118
118 -
 119
119 -
 120
120 -
 121
121 -
 122
122 -
 123
123 -
 124
124 -
 125
125 -
 126
126 -
 127
127 -
 128
128 -
129
-
130
-
131
-
132
-
133
-
134
-
135
-
136
-
137
-
138
-
139
-
140
-
141
-
142
-
143
-
144
-
145
-
146
-
147
-
148
-
149
-
150
-
151
-
152
-
153
-
154
-
155
-
156
 |
 |

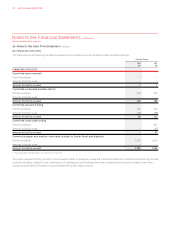
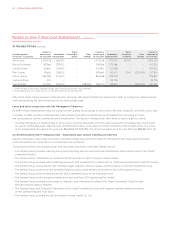
FOR THE YEAR ENDED 30 JUNE 2012
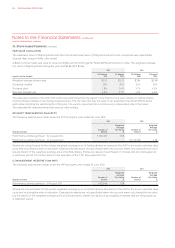
Notes to the Financial Statements continued
Qantas Group
2012
$M
2011
$M
2010
$M
2009
$M
2008
$M
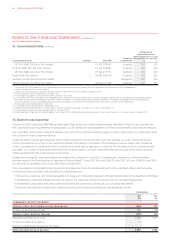
HISTORICAL AMOUNTS
Fair value of plan assets , , , , ,
Present value of defined benefit obligation , , , , ,
(Deficit)/surplus () () () ()
Experience adjustments (loss)/gain on plan assets () () () ()
Experience adjustments gain/(loss) on plan liabilities () () ()
Actuarial estimate adjustments (loss)/gain on plan liabilities () () () ()
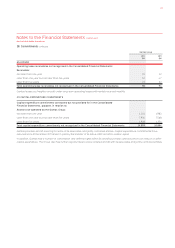
Qantas Group
2012
%
2011
%
PRINCIPAL ACTUARIAL ASSUMPTIONS EXPRESSED AS WEIGHTED AVERAGES PER ANNUM
Discount rate . .
Expected return on plan assets . .
Future salary increases . .
The expected long-term rate of return is based on the weighted average of expected returns on each individual asset class
where the weightings reflect the proportion of defined benefit assets invested in each asset class. Each asset class’ expected
return is based on expectations of average returns over the next 10 years.
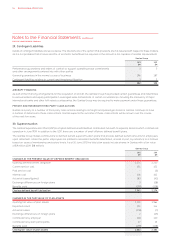
Employer contributions to the defined benefit superannuation plans are based on recommendations by the plans’ actuaries.
It is estimated that $104 million will be paid by Qantas for employees accruing defined benefits for the year ended 30 June 2013
(2011: $105 million for the year ended 30 June 2012).
In April 2009, following the Global Financial Crisis and the resultant weakening of QSP’s financial position, a three year additional
funding plan for the defined benefit divisions was implemented in agreement with the Trustee of the QSP. In May 2012 the additional
funding plan was extended for six months. As at 30 June 2012 Qantas has contributed a total of $83 million of additional funding
(as at 30 June 2011: total of $50 million).
The QSP’s financial position is monitored by the Trustee each quarter and the actuary recommends the amounts of additional
contributions to be made each quarter, as required under the agreed funding plan.
Defined contribution fund
The Qantas Group’s results include $157 million (2011: $154 million) of expenses in relation to defined contribution funds.
30. Superannuation continued
QANTAS ANNUAL REPORT 2012116