Qantas 2012 Annual Report Download - page 102
Download and view the complete annual report
Please find page 102 of the 2012 Qantas annual report below. You can navigate through the pages in the report by either clicking on the pages listed below, or by using the keyword search tool below to find specific information within the annual report.-
 1
1 -
2
-
3
-
4
-
5
-
6
-
7
-
8
-
9
-
10
-
11
-
12
-
13
-
14
-
15
-
16
-
17
-
18
-
19
-
20
-
21
-
22
-
23
-
24
-
25
-
26
-
27
-
28
-
29
-
30
-
31
-
32
-
33
-
34
-
35
-
36
-
37
-
38
-
39
-
40
-
41
-
42
-
43
-
44
-
45
-
46
-
47
-
48
-
49
-
50
-
51
-
52
-
53
-
54
-
55
-
56
-
57
-
58
-
59
-
60
-
61
-
62
-
63
-
64
-
65
-
66
-
67
-
68
-
69
-
70
-
71
-
72
-
73
-
74
-
75
-
76
-
77
-
78
-
79
-
80
-
81
-
82
-
83
-
84
-
85
-
86
-
87
-
88
-
89
-
90
-
91
-
 92
92 -
 93
93 -
 94
94 -
 95
95 -
 96
96 -
 97
97 -
 98
98 -
 99
99 -
 100
100 -
 101
101 -
 102
102 -
 103
103 -
 104
104 -
 105
105 -
 106
106 -
 107
107 -
 108
108 -
 109
109 -
 110
110 -
 111
111 -
 112
112 -
113
-
114
-
115
-
116
-
117
-
118
-
119
-
120
-
121
-
122
-
123
-
124
-
125
-
126
-
127
-
128
-
129
-
130
-
131
-
132
-
133
-
134
-
135
-
136
-
137
-
138
-
139
-
140
-
141
-
142
-
143
-
144
-
145
-
146
-
147
-
148
-
149
-
150
-
151
-
152
-
153
-
154
-
155
-
156
 |
 |

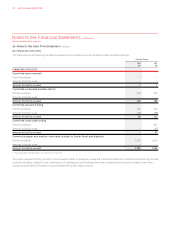
FOR THE YEAR ENDED 30 JUNE 2012
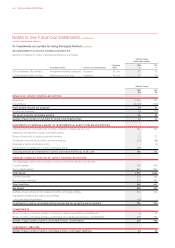
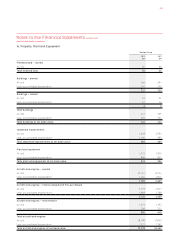
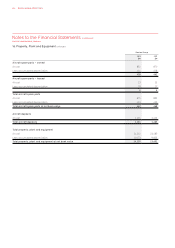
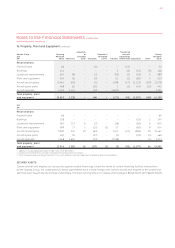
Notes to the Financial Statements continued
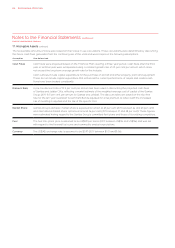
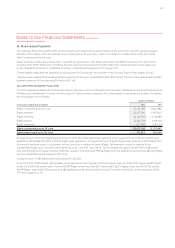
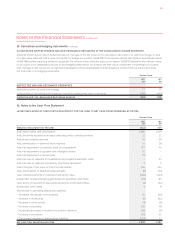
The recoverable amounts of CGUs were based on their value in use calculations. Those calculations were determined by discounting
the future cash flows generated from the continuing use of the units and were based on the following assumptions:
Assumption How determined
Cash Flows Cash flows were projected based on the Financial Plan covering a three-year period. Cash flows after the third
year or terminal year were extrapolated using a constant growth rate of 2.5 per cent per annum, which does
not exceed the long-term average growth rate for the industry.
Cash outflows include capital expenditure for the purchase of aircraft and other property, plant and equipment.
These do not include capital expenditure that enhances the current performance of assets and related cash
flows have been treated consistently.
Discount Rate A pre-tax discount rate of 10.5 per cent per annum has been used in discounting the projected cash flows
of Qantas and Jetstar CGUs, reflecting a market estimate of the weighted average cost of capital of the Qantas
Group (2011: 10.5 per cent per annum for Qantas and Jetstar). The discount rates are based on the risk-free
rate for the ten-year Australian Government Bonds adjusted for a risk premium to reflect both the increased
risk of investing in equities and the risk of the specific CGU.
Market Share Qantas Group’s domestic market share is expected to remain at 65 per cent (2011: between 64 and 65 per cent)
and international market share remains at around 26 per cent (2011: between 27 and 28 per cent). These figures
were estimated having regard to the Qantas Group’s committed fleet plans and those of its existing competitors.
Fuel The fuel into-plane price is assumed to be US$129 per barrel (2011: between US$124 and US$136) and was set
with regard to the forward fuel curve and commodity analyst expectations.
Currency The US$:A$ exchange rate is assumed to be $0.97 (2011: between $1.01 and $1.06).
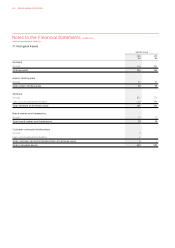
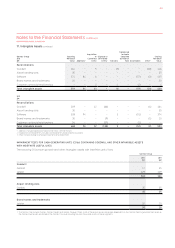
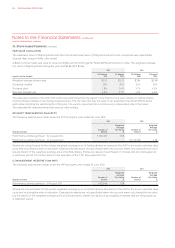
17. Intangible Assets continued
QANTAS ANNUAL REPORT 2012100