Qantas 2006 Annual Report Download - page 94
Download and view the complete annual report
Please find page 94 of the 2006 Qantas annual report below. You can navigate through the pages in the report by either clicking on the pages listed below, or by using the keyword search tool below to find specific information within the annual report.-
 1
1 -
2
-
3
-
4
-
5
-
6
-
7
-
8
-
9
-
10
-
11
-
12
-
13
-
14
-
15
-
16
-
17
-
18
-
19
-
20
-
21
-
22
-
23
-
24
-
25
-
26
-
27
-
28
-
29
-
30
-
31
-
32
-
33
-
34
-
35
-
36
-
37
-
38
-
39
-
40
-
41
-
42
-
43
-
44
-
45
-
46
-
47
-
48
-
49
-
50
-
51
-
52
-
53
-
54
-
55
-
56
-
57
-
58
-
59
-
60
-
61
-
62
-
63
-
64
-
65
-
66
-
67
-
68
-
69
-
70
-
71
-
72
-
73
-
74
-
75
-
76
-
77
-
78
-
79
-
80
-
81
-
82
-
83
-
 84
84 -
 85
85 -
 86
86 -
 87
87 -
 88
88 -
 89
89 -
 90
90 -
 91
91 -
 92
92 -
 93
93 -
 94
94 -
 95
95 -
 96
96 -
 97
97 -
 98
98 -
 99
99 -
 100
100 -
 101
101 -
 102
102 -
 103
103 -
 104
104 -
105
-
106
-
107
-
108
-
109
-
110
-
111
-
112
-
113
-
114
-
115
-
116
-
117
-
118
-
119
-
120
-
121
-
122
-
123
-
124
-
125
-
126
-
127
-
128
-
129
-
130
-
131
-
132
-
133
-
134
-
135
-
136
-
137
-
138
-
139
-
140
-
141
-
142
-
143
-
144
-
145
-
146
-
147
-
148
 |
 |
92
Notes to the Financial Statements
for the year ended 30 June 2006
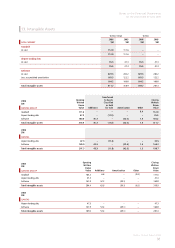
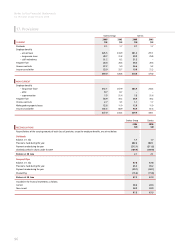
13. Intangible Assets continued
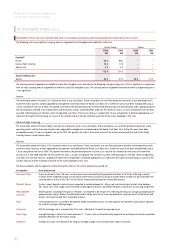
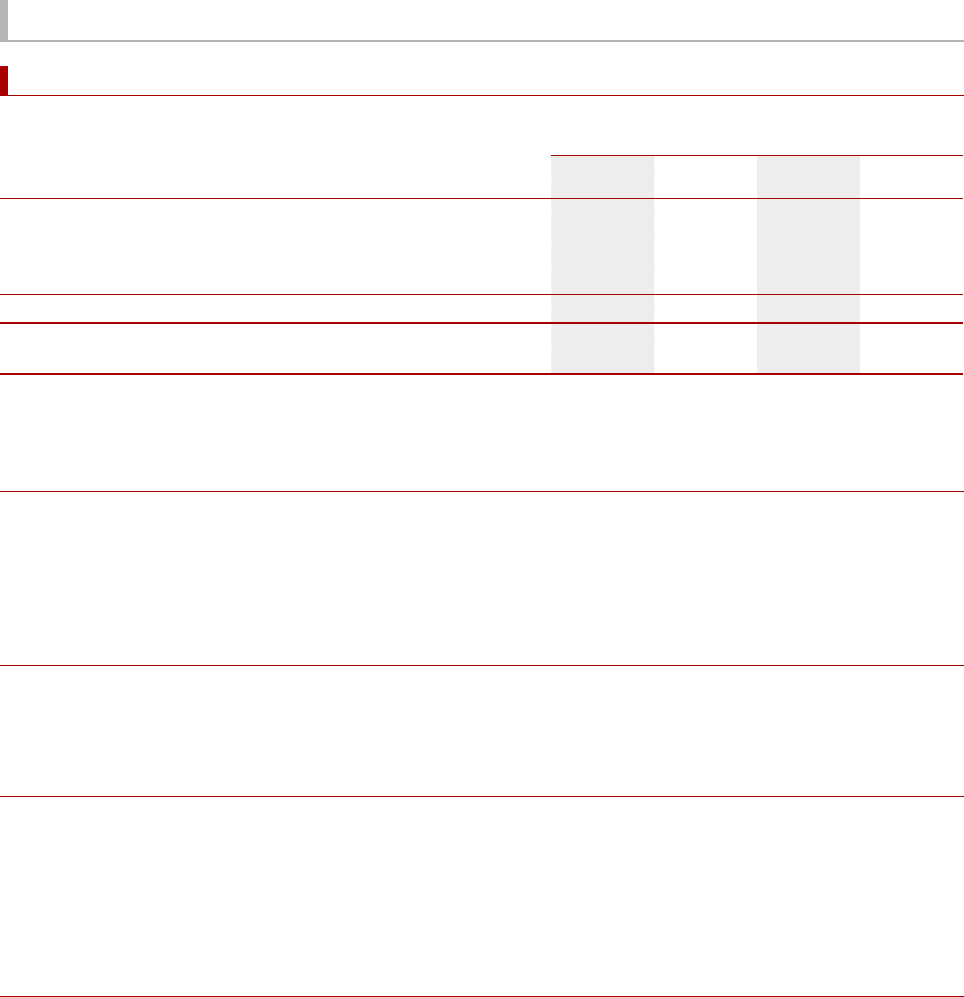
IMPAIRMENT TESTS FOR CASH GENERATING UNITS CONTAINING GOODWILL AND INTANGIBLES WITH INDEFINITE USEFUL LIVES
The following units have significant carrying amounts of goodwill and intangibles with indefinite useful lives:
Qantas Group Qantas
2006
$M
2005
$M
2006
$M
2005
$M
Goodwill
Jetstar 90.5 90.5 ––
Qantas Flight Catering 18.2 17.8 ––
Qantas Link 3.3 3.3 ––
112.0 111.6 ––
Airport landing slots
Qantas 35.5 47.3 35.5 47.3
The carrying amount of goodwill and indefinite useful life intangible assets allocated to the following cash generating units (CGU) is significant in comparison
with the total carrying amount of goodwill or indefinite useful life intangible assets. The carrying amount of goodwill allocated to other cash generating units
is not significant.
Jetstar
The recoverable amount of Jetstar CGU is based on value in use calculations. Those calculations use cash flow projections based on actual operating results
and the five-year business outlook approved by management and endorsed by the Board. Cash flows for a further five years have been extrapolated using a
7.3 per cent growth rate out to 2016. This growth rate reflects the planned expansion of Jetstar both domestically and internationally and is appropriate given
the actual growth achieved since establishment and the Qantas Group’s committed B787 order. For the further ten years, a 2.5 per cent growth rate has been
assumed, reflecting long run inflation, when extrapolating cash flows. The five-year forecast, coupled with 15 year extrapolation is believed appropriate, as it
represents the capital intensive long run nature of the aviation industry and the estimated useful life of the assets employed in this CGU.
Qantas Flight Catering
The recoverable amount of Qantas Flight Catering CGU is based on value in use calculations. Those calculations use cash flow projections based on actual
operating results and the three-year business plan approved by management and endorsed by the Board. Cash flows for a further five years have been
extrapolated using a 2.5 per cent growth rate out to 2014. This growth rate reflects the mature nature of the airline catering industry and Qantas Flight
Catering Group’s current market share.
Qantas
The recoverable amount of Qantas CGU is based on value in use calculations. Those calculations use cash flow projections based on actual operating results
and the five-year business outlook approved by management and endorsed by the Board. Cash flows for a further five years have been extrapolated using a
7.3 per cent growth rate out to 2016. This growth rate reflects the planned expansion of Qantas as a result of the introduction into service of committed
aircraft such as the A380 and B787. For the further ten years, a 2.5 per cent growth rate has been assumed, reflecting long run inflation, when extrapolating
cash flows. The five year forecast, coupled with fifteen year extrapolation is believed appropriate, as it represents the capital intensive long run nature of the
aviation industry and the estimated useful life of the assets employed in this CGU.
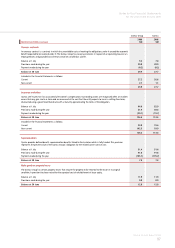
The key assumptions and the approach to determining their value in the current and previous period are:
Assumption How Determined
Discount Rate A pre-tax discount rate of 10.5 per cent has been used in discounting the projected cash flows of all CGUs, reflecting a market
estimate of the weighted average cost of capital of the Qantas Group. This discount would need to exceed 13.2 per cent before the
carrying amount of any of the CGU’s of the Qantas Group would exceed their recoverable amount.
Market Share Qantas Group’s domestic market share is expected to remain between 65 - 68 per cent and international market share between
30 - 35 per cent. These ranges were estimated having regard to Qantas committed fleet plans and those of our existing competitors.
Real Market
Growth
Market growth, excluding the impacts of inflation, is estimated to be 4.8 per cent, reflecting the long run average passenger growth
experienced by Qantas. Market Growth would need to fall by more than 5.2 per cent before the carrying amount of the Jetstar and
Qantas CGU would exceed their recoverable amount.
Fuel Fuel into-plane price is assumed to be between US$85 and US$90 and was set with regard to the spot WTI crude oil price adjusted
for historical average refining margins.
Currency US$:A$ exchange rate is assumed to be 75.3 cents, reflecting a 12 month average spot price.
Fleet Age Average fleet age is forecast to remain between 9 - 11 years and is estimated having regard to the existing contractually committed
long-term fleet plan for the Qantas Group.
Infl ation Inflation of 2.5 per cent represents the long-run average change in the consumer price index in Australia.