Qantas 2006 Annual Report Download - page 126
Download and view the complete annual report
Please find page 126 of the 2006 Qantas annual report below. You can navigate through the pages in the report by either clicking on the pages listed below, or by using the keyword search tool below to find specific information within the annual report.-
 1
1 -
2
-
3
-
4
-
5
-
6
-
7
-
8
-
9
-
10
-
11
-
12
-
13
-
14
-
15
-
16
-
17
-
18
-
19
-
20
-
21
-
22
-
23
-
24
-
25
-
26
-
27
-
28
-
29
-
30
-
31
-
32
-
33
-
34
-
35
-
36
-
37
-
38
-
39
-
40
-
41
-
42
-
43
-
44
-
45
-
46
-
47
-
48
-
49
-
50
-
51
-
52
-
53
-
54
-
55
-
56
-
57
-
58
-
59
-
60
-
61
-
62
-
63
-
64
-
65
-
66
-
67
-
68
-
69
-
70
-
71
-
72
-
73
-
74
-
75
-
76
-
77
-
78
-
79
-
80
-
81
-
82
-
83
-
84
-
85
-
86
-
87
-
88
-
89
-
90
-
91
-
92
-
93
-
94
-
95
-
96
-
97
-
98
-
99
-
100
-
101
-
102
-
103
-
104
-
105
-
106
-
107
-
108
-
109
-
110
-
111
-
112
-
113
-
114
-
115
-
 116
116 -
 117
117 -
 118
118 -
 119
119 -
 120
120 -
 121
121 -
 122
122 -
 123
123 -
 124
124 -
 125
125 -
 126
126 -
 127
127 -
 128
128 -
 129
129 -
 130
130 -
 131
131 -
 132
132 -
 133
133 -
 134
134 -
 135
135 -
 136
136 -
137
-
138
-
139
-
140
-
141
-
142
-
143
-
144
-
145
-
146
-
147
-
148
 |
 |

124
Notes to the Financial Statements
for the year ended 30 June 2006
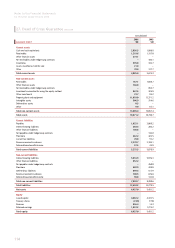
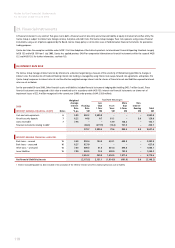
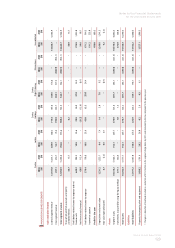
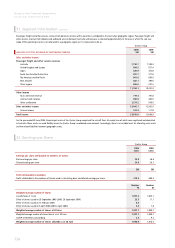
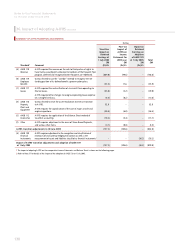
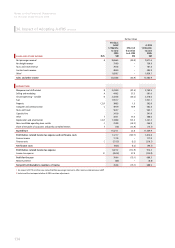
31. Segment Information continued
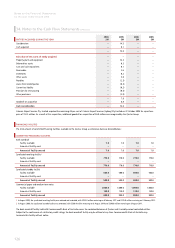
Passenger, freight and other services revenue from domestic services within Australia is attributed to the Australian geographic region. Passenger, freight and
other services revenue from inbound and outbound services between Australia and overseas is allocated proportionately to the area in which the sale was
made. Other operating income is not allocated to a geographic region as it is impractical to do so.
Qantas Group
2006
$M
2005
$M
ANALYSIS OF TOTAL REVENUE BY GEOGRAPHIC REGION
Sales and other income
Passenger, freight and other services revenue
Australia 7,732.7 7,104.3
United Kingdom and Europe 954.5 927.4
Japan 428.9 453.0
South-East Asia/North-East Asia 397.7 377.6
The Americas and the Pacific 961.6 886.9
New Zealand 402.1 390.6
Other regions 306.6 292.5
11,184.1 10,432.3
Other income
Tours and travel revenue 719.4 707.8
Contract work revenue 469.0 484.9
Other unallocated 1,274.2 938.9
Sales and other income 13,646.7 12,563.9
Finance income 163.3 117.0
Total income 13,810.0 12,680.9
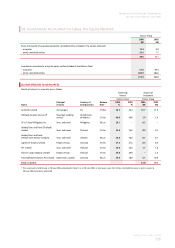
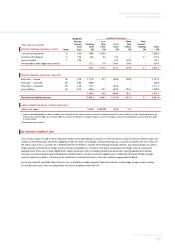
For the year ended 30 June 2006, the principal assets of the Qantas Group comprised the aircraft fleet, all except nine of which were registered and domiciled
in Australia. These assets are used flexibly across the Qantas Group’s worldwide route network. Accordingly, there is no suitable basis for allocating such assets
and the related liabilities between geographic areas.
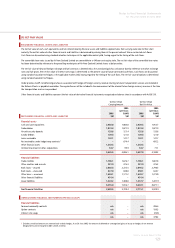
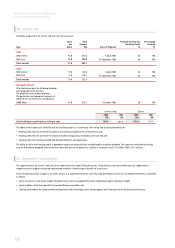
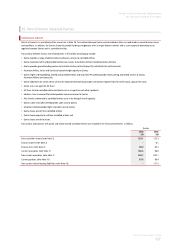
32. Earnings per Share
Qantas Group
2006
Cents
2005
Cents
Earnings per share attributable to members of Qantas
Basic earnings per share 24.9 36.8
Diluted earnings per share 24.8 36.7
$M $M
Profi t attributable to members
Profit attributable to the members of Qantas used in calculating basic and diluted earnings per share 479.5 688.5
Number
M
Number
M
Weighted average number of shares
Issued shares at 1 July 1,897.6 1,845.1
Effect of shares issued on 28 September 2005 (2005: 29 September 2004) 23.5 17.1
Effect of shares issued on 15 February 2006 0.8 –
Effect of shares issued on 5 April 2006 (2005: 6 April 2005) 5.8 7.0
Weighted average number of shares at 30 June 1,927.7 1,869.2
Weighted average number of shares (basic) as at 30 June 1,927.7 1,869.2
QLTEIP Entitlements outstanding 2.3 9.3
Weighted average number of shares (diluted) as at 30 June 1,930.0 1,878.5