Qantas 2006 Annual Report Download - page 123
Download and view the complete annual report
Please find page 123 of the 2006 Qantas annual report below. You can navigate through the pages in the report by either clicking on the pages listed below, or by using the keyword search tool below to find specific information within the annual report.
121
Qantas Annual Report 2006
Notes to the Financial Statements
for the year ended 30 June 2006
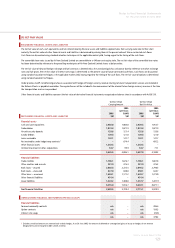
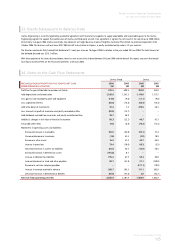
(F) NET FAIR VALUE
RECOGNISED FINANCIAL ASSETS AND LIABILITIES
The net fair value of cash, cash equivalents and non-interest-bearing financial assets and liabilities approximates their carrying value due to their short
maturity. The net fair value of other financial assets and liabilities is determined by valuing them at the present value of future contracted cash flows.
Cash flows are discounted using standard valuation techniques at the applicable market yield, having regard to the timing of the cash flows.
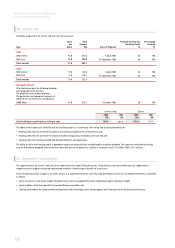
The convertible loan notes issued by Air New Zealand Limited are convertible to a 4.40 per cent equity stake. The net fair value of the convertible loan notes
has been determined by reference to the prevailing market price of Air New Zealand Limited shares at balance date.
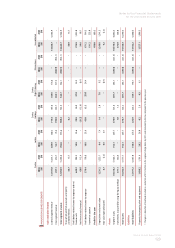
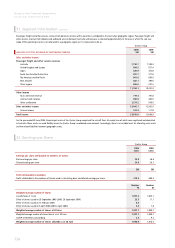
The net fair value of forward foreign exchange and fuel contracts is determined as the unrealised gain/loss at balance date by reference to market exchange
rates and fuel prices. The net fair value of interest rate swaps is determined as the present value of future contracted cash flows. Cash flows are discounted
using standard valuation techniques at the applicable market yield, having regard to the timing of the cash flows. The net fair value of options is determined
using standard valuation techniques.
Under previous GAAP net deferred gains/losses associated with hedges of foreign currency revenue relating to future transportation services are included in
the Balance Sheets as payables/receivables. These gains/losses will be included in the measurement of the relevant future foreign currency revenue at the time
the transportation services are provided.
Other financial assets and liabilities represent the fair value of derivative financial instruments recognised on balance sheet in accordance with AASB 139.
Qantas Group
Carrying Amount
Qantas Group
Net Fair Value
2006
$M
2005
(previous
GAAP)
$M
2006
$M
2005
(previous
GAAP)
$M
RECOGNISED FINANCIAL ASSETS AND LIABILITIES
Financial assets
Cash and cash equivalents 2,902.0 1,903.8 2,920.5 1,912.7
Trade debtors 1,074.3 1,027.9 1,074.3 1,027.9
Aircraft security deposits 129.6 127.4 132.6 133.6
Sundry debtors 120.3 121.0 120.3 121.0
Loans receivable 142.1 141.7 142.1 141.7
Net receivables under hedge/swap contracts1–674.4 –692.2
Other financial assets 1,243.5 –1,243.5 –
Unlisted investment in other corporations 53.7 99.9 53.7 71.1
5,665.5 4,096.1 5,687.0 4,100.2
Financial liabilities
Trade creditors 1,706.1 1,676.7 1,706.1 1,687.8
Other creditors and accruals 281.9 225.3 281.9 225.2
Bank loans – secured 2,302.3 2,725.5 2,396.2 2,798.5
Bank loans – unsecured 627.0 630.0 650.1 644.7
Other loans – unsecured 1,603.1 1,171.2 1,638.7 1,273.0
Other financial liabilities 491.4 –491.4 –
Lease liabilities 1,243.2 1,388.0 1,237.7 1,441.9
8,255.0 7,816.7 8,402.1 8,071.1
Net fi nancial liabilities 2,589.5 3,720.4 2,715.1 3,970.9
UNRECOGNISED FINANCIAL INSTRUMENTS (PREVIOUS GAAP)
Financial liabilities
Forward commodity contracts n/a –n/a 206.4
Option contracts n/a –n/a 199.3
Interest rate swaps n/a –n/a (35.5)
n/a –n/a 370.2
1 Excludes unrealised amounts on revenue back-to-back hedges. As at 30 June 2005, the amount of deferred or unrecognised gains or losses on hedges of net revenue
designated to service long-term debt is $228.4 million.


