Qantas 2000 Annual Report Download - page 48
Download and view the complete annual report
Please find page 48 of the 2000 Qantas annual report below. You can navigate through the pages in the report by either clicking on the pages listed below, or by using the keyword search tool below to find specific information within the annual report.-
 1
1 -
2
-
3
-
4
-
5
-
6
-
7
-
8
-
9
-
10
-
11
-
12
-
13
-
14
-
15
-
16
-
17
-
18
-
19
-
20
-
21
-
22
-
23
-
24
-
25
-
26
-
27
-
28
-
29
-
30
-
31
-
32
-
33
-
34
-
35
-
36
-
37
-
 38
38 -
 39
39 -
 40
40 -
 41
41 -
 42
42 -
 43
43 -
 44
44 -
 45
45 -
 46
46 -
 47
47 -
 48
48 -
 49
49 -
 50
50 -
 51
51 -
 52
52
 |
 |

46
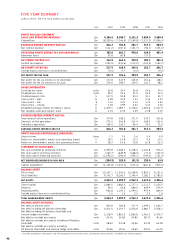
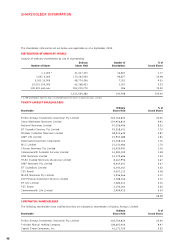
FIVE YEAR SUMMARY
QANTAS GROUP FOR THE YEAR ENDED 30 JUNE 2000
Unit 2000 1999 1998 1997 1996
PROFIT AND LOSS STATEMENT
SALES AND OPERATING REVENUE * $m 9,106.8 8,448.7 8,131.5 7,834.4 7,600.4
Expenditure $m (8,290.6) (7,746.9) (7,549.8) (7,317.2) (7,096.0)
EARNINGS BEFORE INTEREST AND TAX $m 816.2 701.8 581.7 517.2 504.4
Net interest expense $m (111.2) (100.1) (103.7) (96.3) (103.0)
OPERATING PROFIT BEFORE TAX AND ABNORMALS $m 705.0 601.7 478.0 420.9 401.4
Abnormal items $m 57.8 60.8 – (17.2) –
NET PROFIT BEFORE TAX $m 762.8 662.5 478.0 403.7 401.4
Income tax expense $m (244.9) (241.6) (173.0) (151.0) (154.7)
NET PROFIT AFTER TAX $m 517.9 420.9 305.0 252.7 246.7
Outside equity interests in net (profit)/loss $m (0.6) 0.7 (0.2) – (0.5)
NET PROFIT FOR THE YEAR $m 517.3 421.6 304.8 252.7 246.2
Net profit for the six months to 31 December $m 337.8 222.9 165.8 151.6 148.1
Net profit for the six months to 30 June $m 179.5 198.7 139.0 101.1 98.1
SHARE INFORMATION
Earnings per share cents 42.8 35.4 26.8 23.6 24.2
Dividends per share cents 59.0 32.5 13.5 13.0 13.0
Dividend payout ratio % 137.9 91.8 50.4 55.1 53.7
Share price – high $ 5.28 5.00 3.21 3.15 2.47
Share price – low $ 3.12 2.27 2.13 1.79 2.03
Share price – closing $ 3.38 4.99 2.43 3.10 2.15
Weighted average number of ordinary shares m 1,209.3 1,189.7 1,138.6 1,069.6 1,017.9
Net tangible asset backing per share $ 2.34 2.52 2.49 2.38 2.35
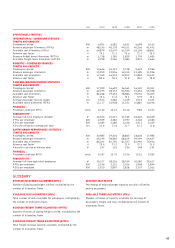
EARNINGS BEFORE INTEREST AND TAX
International airline operations $m 374.8 308.3 271.9 274.7 267.8
Domestic airline operations $m 272.0 256.8 213.4 168.3 163.6
Subsidiary operations $m 169.4 136.7 96.4 74.2 73.0
EARNINGS BEFORE INTEREST AND TAX $m 816.2 701.8 581.7 517.2 504.4
PROFIT AND LOSS PERFORMANCE INDICATORS
Interest cover times 7.3 7.0 5.6 5.4 4.9
Return on shareholders’ equity (excl operating leases) % 18.1 13.8 10.3 9.5 10.1
Return on shareholders’ equity (incl operating leases) % 18.3 14.6 10.8 10.8 13.5
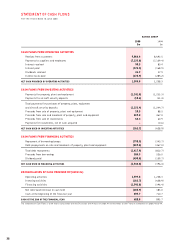
STATEMENT OF CASH FLOWS
Net cash provided by operating activities $m 1,599.8 1,208.3 1,218.4 1,110.8 936.4
Net cash used in investing activities $m (262.7) (628.9) (668.0) (71.1) (152.4)
Net cash used in financing activities $m (1,542.0) (396.4) (592.3) (744.3) (721.0)
NET (DECREASE)/INCREASE IN CASH HELD $m (204.9) 183.0 (41.9) 295.4 63.0
Capital expenditure $m (1,141.8) (1,233.3) (673.0) (610.6) (503.5)
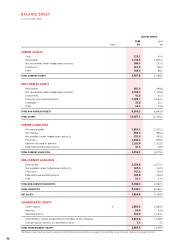
BALANCE SHEET
Total assets $m 12,007.1 11,226.6 10,358.8 9,852.1 9,221.6
Total liabilities $m 9,142.7 8,166.7 7,396.4 7,181.1 6,785.0
NET ASSETS $m 2,864.4 3,059.9 2,962.4 2,671.0 2,436.6
Share capital $m 1,882.0 1,882.0 1,177.3 1,111.7 1,035.5
Reserves $m 54.0 52.8 689.0 609.9 574.4
Retained profits $m 926.8 1,124.1 1,094.1 947.4 824.9
Outside equity interests in controlled entities $m 1.6 1.0 2.0 2.0 1.8
TOTAL SHAREHOLDERS’ EQUITY $m 2,864.4 3,059.9 2,962.4 2,671.0 2,436.6
BALANCE SHEET STATISTICS
Net debt on balance sheet $m 925.8 782.8 737.4 1,049.1 1,605.7
Net debt including off balance sheet debt $m 2,503.6 2,134.7 2,226.8 2,680.7 3,558.1
Net debt including off balance sheet debt and
revenue hedge receivables $m 2,128.9 1,862.5 1,856.8 2,461.3 3,435.7
Net debt to net debt plus equity ratio 24:76 20:80 20:80 28:72 40:60
Net debt to net debt plus equity including off balance
sheet debt ratio 48:52 42:58 44:56 51:49 62:38
Net debt to net debt plus equity including
off balance sheet debt and revenue hedge receivables ratio 44:56 39:61 40:60 49:51 61:39
* Excludes proceeds on sale (and on sale and leaseback) of non-current assets, and interest revenue which is included in net interest expense.