Qantas 2000 Annual Report Download - page 29
Download and view the complete annual report
Please find page 29 of the 2000 Qantas annual report below. You can navigate through the pages in the report by either clicking on the pages listed below, or by using the keyword search tool below to find specific information within the annual report.-
 1
1 -
2
-
3
-
4
-
5
-
6
-
7
-
8
-
9
-
10
-
11
-
12
-
13
-
14
-
15
-
16
-
17
-
18
-
 19
19 -
 20
20 -
 21
21 -
 22
22 -
 23
23 -
 24
24 -
 25
25 -
 26
26 -
 27
27 -
 28
28 -
 29
29 -
 30
30 -
 31
31 -
 32
32 -
 33
33 -
 34
34 -
 35
35 -
 36
36 -
 37
37 -
 38
38 -
 39
39 -
40
-
41
-
42
-
43
-
44
-
45
-
46
-
47
-
48
-
49
-
50
-
51
-
52
 |
 |

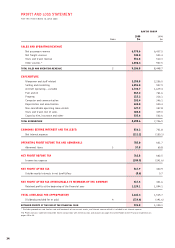
27
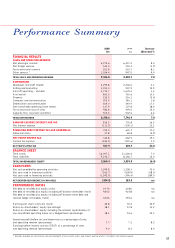
2000 1999 Increase/
$m $m (Decrease) %
FINANCIAL RESULTS
SALES AND OPERATING REVENUE
Net passenger revenue 6,975.6 6,437.5 8.4
Net freight revenue 543.0 553.4 (1.9)
Tours and travel revenue 551.8 510.3 8.1
Other sources * 1,036.4 947.5 9.4
TOTAL SALES AND OPERATING REVENUE 9,106.8 8,448.7 7.8
EXPENDITURE
Manpower and staff related 2,295.8 2,206.0 4.1
Selling and marketing 1,051.0 947.9 10.9
Aircraft operating – variable 1,732.7 1,679.4 3.2
Fuel and oil 863.2 761.6 13.3
Property 215.2 216.1 (0.4)
Computer and communication 352.4 346.1 1.8
Depreciation and amortisation 634.0 540.4 17.3
Non-cancellable operating lease rentals 127.9 107.8 18.6
Tours and travel cost of sales 482.8 439.0 10.0
Capacity hire, insurance and other 535.6 502.6 6.6
TOTAL EXPENDITURE 8,290.6 7,746.9 7.0
EARNINGS BEFORE INTEREST AND TAX 816.2 701.8 16.3
Net interest expense (111.2) (100.1) 11.1
OPERATING PROFIT BEFORE TAX AND ABNORMALS 705.0 601.7 17.2
Abnormal items 57.8 60.8 (4.9)
NET PROFIT BEFORE TAX 762.8 662.5 15.1
Income tax expense (244.9) (241.6) 1.4
NET PROFIT AFTER TAX 517.9 420.9 23.0
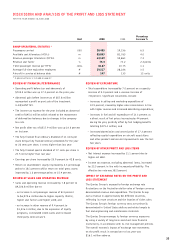
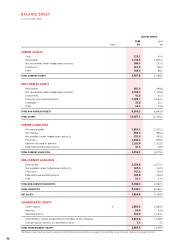
BALANCE SHEET
Total assets 12,007.1 11,226.6 7.0
Total liabilities 9,142.7 8,166.7 12.0
TOTAL SHAREHOLDERS’ EQUITY 2,864.4 3,059.9 (6.4)
CASH FLOWS
Net cash provided by operating activities 1,599.8 1,208.3 32.4
Net cash used in investing activities (262.7) (628.9) (58.2)
Net cash used in financing activities (1,542.0) (396.4) 289.0
NET (DECREASE)/INCREASE IN CASH HELD (204.9) 183.0 n/a
PERFORMANCE RATIOS
Net debt to net debt plus equity (ratio) 24:76 20:80 n/a
Net debt to net debt plus equity including off balance sheet debt (ratio) 48:52 42:58 n/a
Net debt to net debt plus equity including off balance sheet debt and
revenue hedge receivables (ratio) 44:56 39:61 n/a
Earnings per share (cents per share) 42.8 35.4 20.9
Return on shareholders’ equity (percentage) 18.1 13.8 31.2
Return on shareholders’ equity including the notional capitalisation of
non-cancellable operating leases on a hedged basis (percentage) 18.3 14.6 25.3
Operating profit before tax and abnormals as a percentage of sales
and operating revenue (percentage) 7.7 7.1 8.5
Earnings before interest and tax (EBIT) as a percentage of sales
and operating revenue (percentage) 9.0 8.3 8.4
* Excludes proceeds on sale (and on sale and leaseback) of non-current assets, and interest revenue which is included in net interest expense.
Performance Summary