Porsche 2012 Annual Report Download - page 219
Download and view the complete annual report
Please find page 219 of the 2012 Porsche annual report below. You can navigate through the pages in the report by either clicking on the pages listed below, or by using the keyword search tool below to find specific information within the annual report.-
 1
1 -
2
-
3
-
4
-
5
-
6
-
7
-
8
-
9
-
10
-
11
-
12
-
13
-
14
-
15
-
16
-
17
-
18
-
19
-
20
-
21
-
22
-
23
-
24
-
25
-
26
-
27
-
28
-
29
-
30
-
31
-
32
-
33
-
34
-
35
-
36
-
37
-
38
-
39
-
40
-
41
-
42
-
43
-
44
-
45
-
46
-
47
-
48
-
49
-
50
-
51
-
52
-
53
-
54
-
55
-
56
-
57
-
58
-
59
-
60
-
61
-
62
-
63
-
64
-
65
-
66
-
67
-
68
-
69
-
70
-
71
-
72
-
73
-
74
-
75
-
76
-
77
-
78
-
79
-
80
-
81
-
82
-
83
-
84
-
85
-
86
-
87
-
88
-
89
-
90
-
91
-
92
-
93
-
94
-
95
-
96
-
97
-
98
-
99
-
100
-
101
-
102
-
103
-
104
-
105
-
106
-
107
-
108
-
109
-
110
-
111
-
112
-
113
-
114
-
115
-
116
-
117
-
118
-
119
-
120
-
121
-
122
-
123
-
124
-
125
-
126
-
127
-
128
-
129
-
130
-
131
-
132
-
133
-
134
-
135
-
136
-
137
-
138
-
139
-
140
-
141
-
142
-
143
-
144
-
145
-
146
-
147
-
148
-
149
-
150
-
151
-
152
-
153
-
154
-
155
-
156
-
157
-
158
-
159
-
160
-
161
-
162
-
163
-
164
-
165
-
166
-
167
-
168
-
169
-
170
-
171
-
172
-
173
-
174
-
175
-
176
-
177
-
178
-
179
-
180
-
181
-
182
-
183
-
184
-
185
-
186
-
187
-
188
-
189
-
190
-
191
-
192
-
193
-
194
-
195
-
196
-
197
-
198
-
199
-
200
-
201
-
202
-
203
-
204
-
205
-
206
-
207
-
208
-
 209
209 -
 210
210 -
 211
211 -
 212
212 -
 213
213 -
 214
214 -
 215
215 -
 216
216 -
 217
217 -
 218
218 -
 219
219 -
 220
220 -
 221
221 -
 222
222 -
 223
223 -
 224
224 -
 225
225 -
 226
226 -
 227
227 -
 228
228 -
 229
229 -
230
-
231
-
232
-
233
-
234
-
235
-
236
-
237
-
238
-
239
-
240
-
241
-
242
-
243
-
244
-
245
-
246
-
247
-
248
-
249
-
250
-
251
-
252
-
253
-
254
-
255
-
256
-
257
-
258
-
259
-
260
-
261
-
262
-
263
-
264
-
265
-
266
-
267
-
268
-
269
-
270
 |
 |

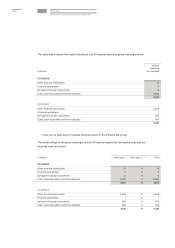
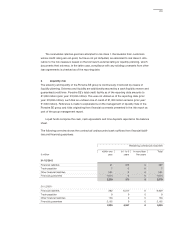
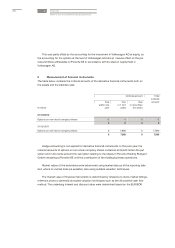
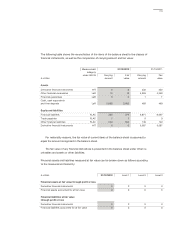
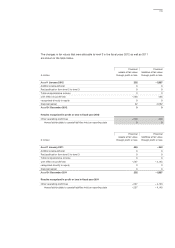
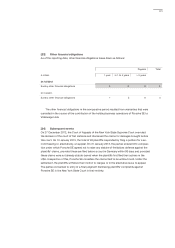
The changes in fair values that were allocable to level 3 in the fiscal years 2012 as well as 2011
are shown in the table below.
Financial Financial
€ million
assets at fair value
through profit or loss
liabilities at fair value
through profit or loss
As of 1 January 2012 232 – 5,087
Additions (acquisitions) 0 0
Reclassification from level 2 to level 3 0 0
Total comprehensive income 0 0
with effect on profit/loss – 200 405
recognized directly in equity 0 0
Disposal (sales) 32 4,682
As of 31 December 2012 0 0
Results recognized in profit or loss in fiscal year 2012
Other operating profit/loss – 200 405
thereof attributable to assets/liabilities held on reporting date 0 0
Financial Financial
€ million
assets at fair value
through profit or loss
liabilities at fair value
through profit or loss
As of 1 January 2011 459 – 942
Additions (acquisitions) 0 0
Reclassification from level 2 to level 3 0 0
Total comprehensive income 0 0
with effect on profit/loss – 227 – 4,145
recognized directly in equity 0 0
Disposal (sales) 0 0
As of 31 December 2011 232 – 5,087
Results recognized in profit or loss in fiscal year 2011
Other operating profit/loss – 227 – 4,145
thereof attributable to assets/liabilities held on reporting date – 227 – 4,145
215